Since virtually every task you perform in EnSight involves some form of part manipulation, it is vital to understand how parts work.
Parts are either built during the reading/loading process (such as → ) or created during an EnSight session. Parts created during reading/loading are called model parts and are based on your computational mesh and associated surfaces as defined in your data files. Model parts can also be created during an EnSight session by performing geometric operations (such as a copy) on other model parts.
All other parts are created during an EnSight session and are called created or derived parts. Created parts are built using one or more other parts as the parent parts. The created parts are said to depend on the parent parts. If one or more of the parent parts change, all parts depending on those parent parts are automatically recalculated and redisplayed to reflect the change. Examples of created parts include clipping planes, isosurfaces, isocontours, and particle traces.
Only model parts will be used in this section. The next two chapters will work with created parts.
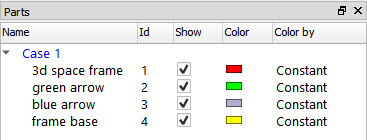
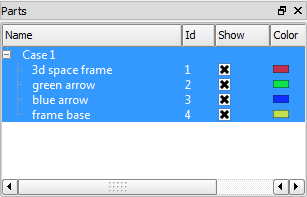
The Parts list provides access to all parts. Each part is listed individually in a scrollable list. By default, each entry provides a part descriptor (name) and additional pieces of information:
Case number
Part Descriptor
Part number or Part ID (as designated in the data or assigned by EnSight)
Part Visibility
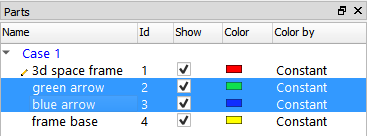
Part Color and what variable it’s colored by
EnSight provides a large number of attributes that can be edited on a per-part basis. Attributes control the appearance or behavior of parts. Examples include visibility, color, line width, and transparency. Part attributes for selected parts can be changed via the Quick Action Icon Bar. Some global part attributes can be changed in the View menu. For example, View → Shaded (or the shaded toggle on the desktop) enables/disables shaded surface display for all parts. For example, there is a shaded surface icon in the Quick Acton Icon Bar for parts that enables/disables shaded surface display on a per-part basis, and a global toggle on the Tools Icon Bar that turns it on and off on a global basis.
Many operations in EnSight (such as setting attributes) require that the parts to be acted upon are selected (highlighted) prior to the operation. Items in the Parts list are selected by placing the mouse pointer over the item and clicking the left mouse button. You can extend a selection by pressing Shift or Ctrl as you click an item. Additional techniques for selecting items in lists are discussed in Lists.
In the remainder of this section, we will explore parts and changing part attributes.
The first task is to enable shaded (hidden surface) display. By default, the part-specific shaded attribute is on. By toggling on the corresponding Shaded toggle on the Desktop, we enable hidden surface display for all parts.
If the Shaded Toggle is not ON, click it to toggle shaded surface display for all parts (icon becomes brighter). Leave shaded ON.
All objects in the Graphics Window are now displayed with shaded surfaces. Turning this toggle off will result in a wireframe display. We can now selectively disable shaded display for individual parts.

Select the green arrow and blue arrow parts in the Parts list: place the mouse pointer over the green arrow part, click the left mouse button, followed by a Ctrl left click (push and hold Ctrl on the keyboard and press the left mouse button) on the blue arrow part. When completed both parts should be highlighted in the Part list.
Note: The selected parts are highlighted in the graphics area. To toggle this off, click on the Highlight Selected parts icon. Toggle it back ON.

Click the Part Shaded Toggle to disable shaded surface display for the selected parts.

Note: The Part Shaded Toggle icon changes (the icon will be dimmed) to reflect the fact that the selected parts have shaded disabled.
Let’s change the line width of the selected parts
 :
:Click the Part Line Width pulldown and select 3 pixels from the menu.
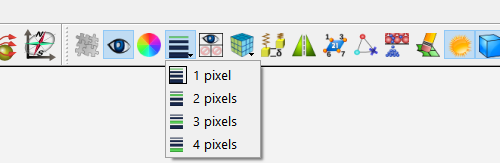
Note: The line width of the selected parts (the arrows) has increased.
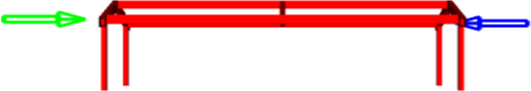
Select the frame base part in the Parts list.
Click the Part Visibility Toggle to disable display of the part.

After these operations, the geometry in your Graphics Display should look like the following.
Parts are assigned a default color when loaded into EnSight. These colors are constant, meaning that every portion of the part is colored the same. Parts can also be colored by a variable value. Since the value associated with a variable typically varies from node to node, the displayed color will vary across the surface of the part.
To change part colors:
Select all the parts in the Parts list by using the Left mouse button to click on the Case1 line in the Part list.
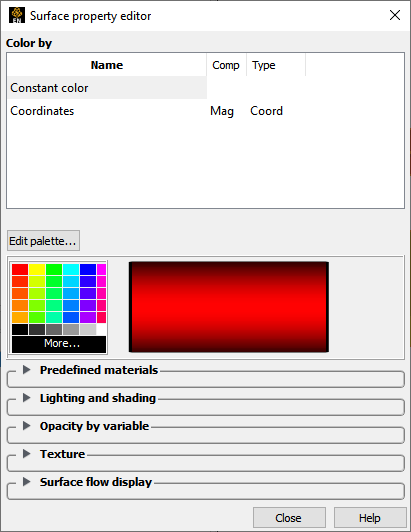
Click the Color/Surface Property icon in the Quick Action Icon Bar.

The Part color, lighting, & transparency dialog opens.
Note: The variables list is set to Constant color.
Pick a shade of gray from the bottom row of the color palette.
Note: All parts in the Graphics Window are now colored by the same shade of gray.
Although this dataset has no associated variable data, we can still color the parts by a variable since EnSight provides some defaults: Coordinates and Time. The Coordinates variable treats the XYZ coordinate of a node as a vector; color is assigned based on the magnitude of that vector.
Select Coordinates from the Color by list.
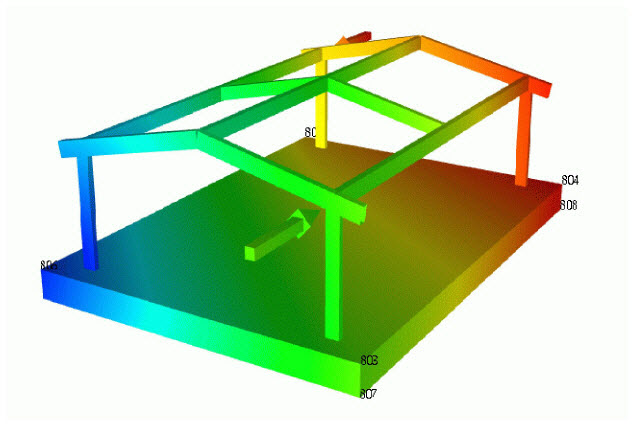
Note: Pay close attention to the color change. The left rear post of the frame is closest to the origin of the coordinate system and is colored blue. The right front post of the frame farthest from the origin is colored red.
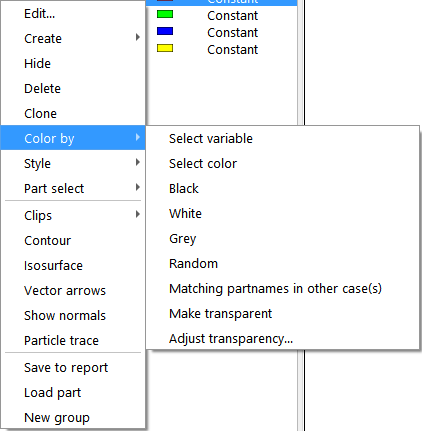
Another way to color a part is to utilize the extensive right-click capability. To test this, reselect all of the parts using Step 7.
Right-click any of the selected parts in the list which brings up a right-click menu.
Select Color By then either select Select Variable or Select Color.
See How To Change Color (Help → How to manual...) for more information.
Up to this point, all parts have been selected by clicking in the Parts list. You can also select parts by picking them in the Graphics Window. Although this dataset contains only four parts, most contain many more and selecting parts via the list can become tedious.
To select parts by picking (see Select Parts for more information):
Move the mouse into the Graphics Window and place the pointer over the arrow on the left side of the model.
Left click on this part.
Look at the Parts list: the green arrow part (number 2) should now be the only part selected. (If this is not the case, be sure the mouse pointer is directly over one of the lines of the part left-click again.)
Move the mouse pointer over the arrow on the right side of the model.
Press and hold the Ctrl key. With the Ctrl key still down, left-click the mouse button while it is over the right arrow part.
Holding down the Ctrl key during the pick extends the current selection: both the green arrow and the blue arrow parts should now be selected in the Parts list. See Select Parts for more information.
Note: The selected parts are highlighted in the graphics window to assist you in identifying selected parts.
Toggle the highlight parts toggle OFF.
EnSight indicates in the graphics window which parts are selected as long as the global toggle is ON.
Now toggle the highlight parts toggle ON.
Click the Part Shaded Toggle to enable shaded surface display for the selected parts.
Select the frame base part in the Parts list.
Click the Part Visibility Toggle to enable display of the part.
EnSight can display node and element labels on selected parts. The label values are either provided explicitly from the dataset or are provided by EnSight. To display node labels:
Click the Node/Element Labeling icon
 , and toggle on Node label
visibility in the dialog that comes up, then close the dialog.
, and toggle on Node label
visibility in the dialog that comes up, then close the dialog.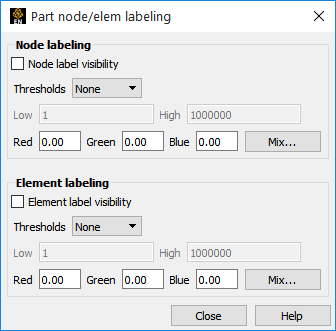
See How To Display Labels (Help → How to manual...) for more information.
After these operations (and some rotate and zoom transformations) your Graphics Window should look something like the following.
Note: The node labels have been colored black here to contrast with the white background - your labels will be white on a darkened background.