


Results Legend
The results legend displays the numerical range of the results, as well as color bands representing those range of values. The legend is visible after solving your simulation and displaying the results. Click and drag the legend to place it anywhere in the graphics window.
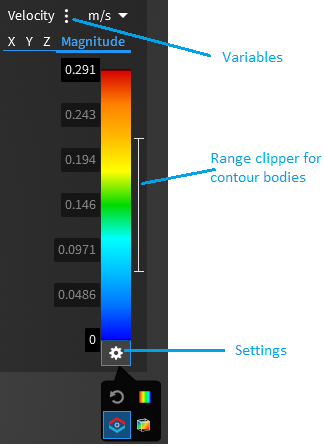
The legend shows the minimum and maximum values of the displayed results for the selected variable. Change the range of values to display by sliding the top border and bottom border of the legend up and down. Alternatively, you can overwrite the minimum and maximum values.
You can probe the solution anywhere on your model by mousing over the contour or iso-surface in Refine, or any result type in Explore. A value is displayed in the legend and changes as you move to a different location in your model.
Additional results legend settings are available to help you visualize and analyze your results.
Show min/max locations  |
Shows or hides the minimum and maximum value locations on your model. |
Reset user defined ranges  |
Resets the legend to the default values. |
Toggle gradient style  |
Switches between displaying results as distinct or smooth color bands. |
Display out-of-range results as muted colors  |
Switches the color display for out-of-range results. Results that fall outside the maximum and minimum values you set on the results legend will have muted colors. |
Changes to the legend settings are saved along with your project and are available when you resume the simulation.