When a job is submitted to an HPC cluster, CPU and memory usage data is sent from the HPC cluster head node to the DCG portal every minute. You can use the HeadNodePerf thread to view this data for a selected job. Such data is helpful when a job has failed, as it enables you to verify whether or not the remote machine had enough resources to run the solution.
When viewing the HeadNodePerf thread you can create custom graphs that show metrics of your choice.
To view performance graphs for the cluster head node:
In the navigation panel, select .
Click a job name.
In the job view, select the Graph monitor tab.
Select from the Display drop-down menu.
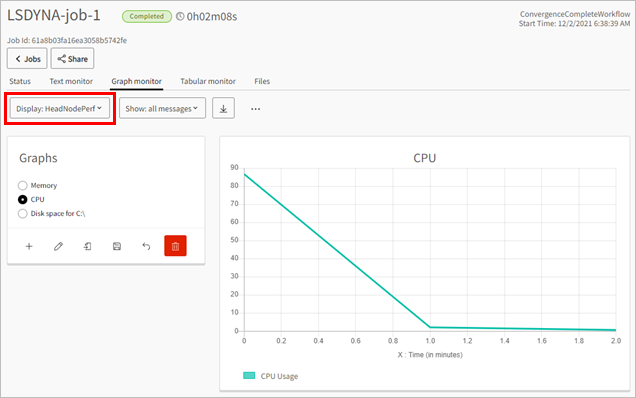
In the Graphs pane, select an existing graph to view.
To create a new graph:
Click
 .
.In the dialog box, add a graph name and select the desired values to plot on the X and Y axes.
When there is a large range of values, selecting the Y logarithmic option presents data on a logarithmic scale rather than a linear scale.
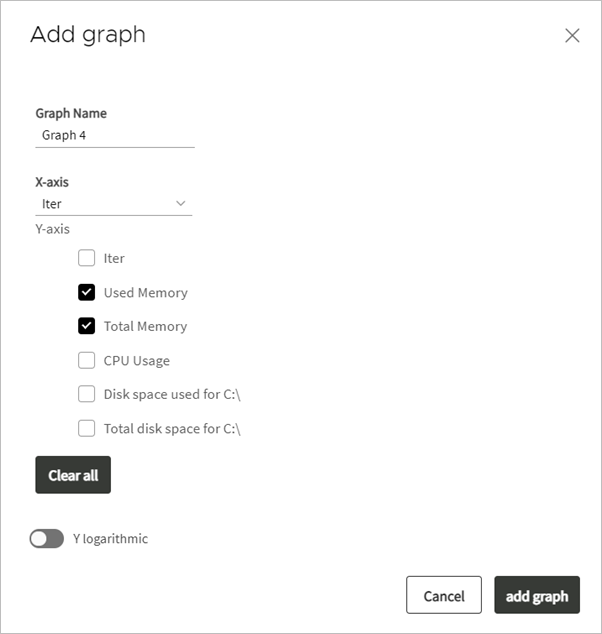
Click .
To edit a graph:
In the Graphs pane, select an existing graph and click
 .
.In the dialog box, change the settings as required.
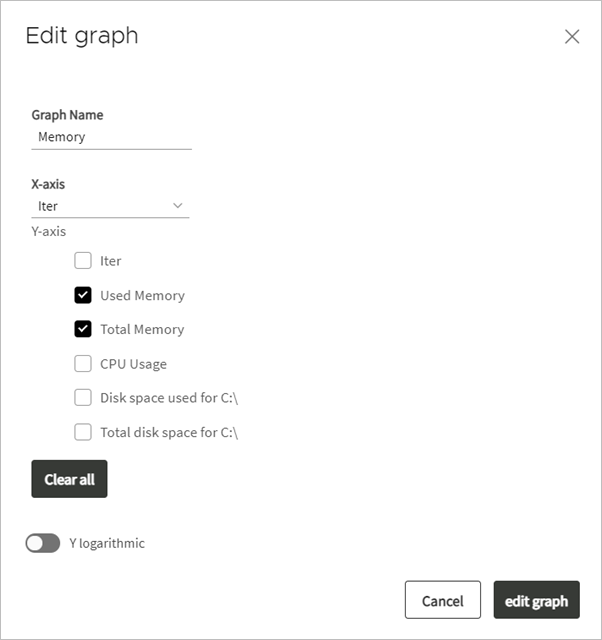
Click .
To save the available graph configurations to a JSON file for subsequent reuse:
Click
 .
.Enter a name for the JSON file and click .
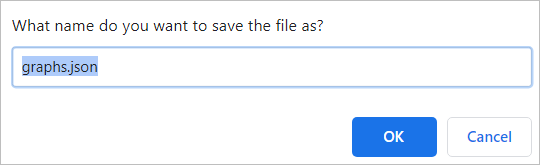
The graph file is downloaded to the default download location set in your browser settings.
To load graph configurations that you previously saved to a JSON file:
Click
 .
.Browse to the location of the JSON file, select it and click .
To restore the graphs to their original configuration:
Click
 .
.In the dialog box, click .

To delete a graph:
Under Graphs, select an existing graph and click
 .
.In the dialog box, click .