


During the solution phase, and after the solution has been completed, you can display convergence plots. When a convergence plot is displayed, you can use two additional drop-down menus to choose the X-Axis and Y-Axis values to plot.
When a solution is in progress, convergence plots update in real time.
To view convergence plots:
In the navigation panel, select .
Click a job name.
In the job view, select the Graph monitor tab.
Select from the Display drop-down menu.
Tip: To ensure that the complete curve is plotted, select All messages from the Show drop-down menu.
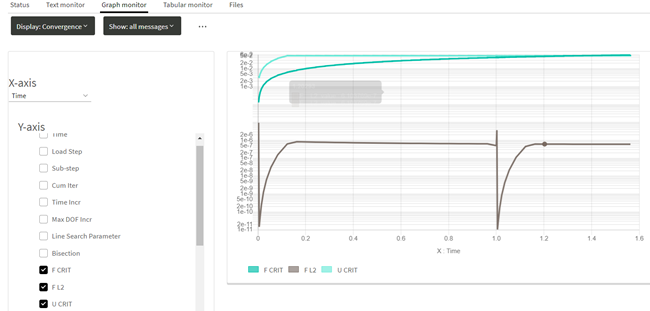
Select the desired values to plot on the X and Y axes.
The following choices are available for Fluent:
continuity
epsilon
Iteration
k
x-velocity
y-velocity
z-velocity
When there is a large range of values, selecting the Y logarithmic option presents data on a logarithmic scale rather than a linear scale.
You can also plot multiple curves on the same graph.
The following choices are available for Mechanical:
Bisection
Cum Iter
F CRIT
F L2
Line Search Parameter
Load Step
Max DOF Incr
Remesh
Sub-step
Time Incr
U CRIT
U INF