This control sets a maximum number of species displayed in the Reaction Path Diagram. By default, species are ranked according to the maximum rate of depletion of all species at the particular point selected in the Ansys Chemkin solution. The species with the maximum depletion rate determines the top of the "tree" for the Reaction Path Diagram. Other species that will be included in the display are then chosen according to a similar ordering, with the added constraint that they be connected to the first species selected. In addition to this default behavior, the target (top of the tree) species can be selected explicitly in the Control Panel, through several options described below. However the tree is determined, no more than the Maximum Number of Species will be displayed on the Reaction Path Diagram at any one time. In this way, the size of the diagram can be controlled by this option.
Species of interest can be selected in the Species List tab as shown in Figure 4.7: The Species List tab for selecting species available for start and end. Preferred species persist beyond the application lifetime.. By default the reactants are available for selection. Species highlighted in the Species List tab on the Solution panel are available in the Species Selection tab, where they can be dynamically selected and deselected as the Start and/or End Species used to generate the Reaction Path Diagram. There are three options to determining the Reaction Path Diagram using the Species Selection Start and End Species :
Figure 4.7: The Species List tab for selecting species available for start and end. Preferred species persist beyond the application lifetime.

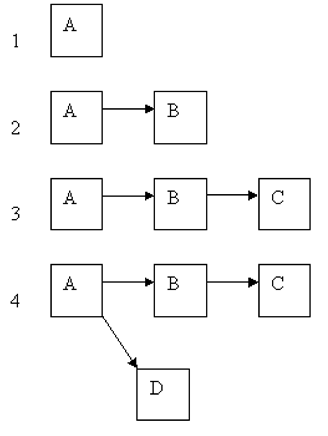
Selection of only a Start Species will generate a diagram with the given species as the origin, and additional species are added to the diagram according to the magnitude of the rate-of-production (ROP) of species that can be connected to one of the existing species on the diagram. This growth of the tree is continued until the maximum number of species displayed is reached. A schematic of this procedure is provided in Figure 4.8: The first four steps when generating a diagram from the Start Species.
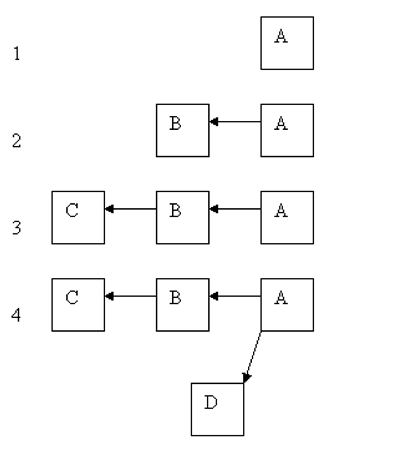
Selection of only an End Species results in analogous behavior to the Start Species selection, except that the species will be added to the Reaction Path Diagram according to ROP channels leading to the formation of the existing species on the Diagram. The steps for building the tree in this case is shown in Figure 4.9: The first four steps when building a diagram from an End Species.
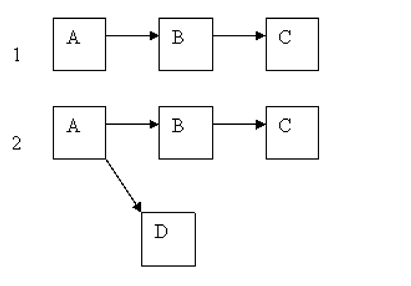
The selection of both Start and End Species will cause the inclusion of species connecting the maximum ROP route from Start to End. Additional species are added to the Diagram according to maximum ROP pathways originating from the species already in the Diagram and that are along the trail connecting the Start and End Species. This is illustrated in Figure 4.10: The first two steps when building a diagram from the Start and End Species.