Solution data points are selected from a sub-section of the Control Panel, below the Line Thickness slider bar. Ansys Chemkin generates solutions that vary with one or more independent variable (for example, time, distance or some varied parameter). The Reaction Path Analyzer therefore provides a Solution selection interface that allows dynamic selection of a point along a solution varying in one dimension. The Solution point selected will determine the local values of ROP that are used to generate the Reaction Path Diagram. Sub-components of the Solution panel include Solution Selection, Dependent Variable Selection, and the Data Point Display and Selection. These are described briefly below.
The Solution Selection interface allows the selection among several solutions that may be contained in a single solution file. For example, if a 1-D simulation was run with continuations, is allows the selection of which continuation solution will be analyzed. In the Multizone model it will allow the selection of an individual zone, as well as the zone average. Similarly for the Spark Ignition (SI) model, the unburned, burned, and average zones are available here for selection. IIf there is only one solution contained in the Ansys Chemkin solution file, this option will be disabled.
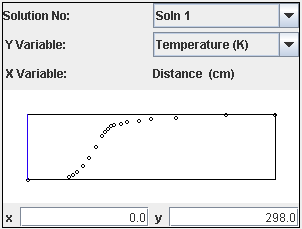
The Y Variable pull-down menu allows selection of the dependent variable that will be displayed in the graph window below the Selection menu. By default, this is set to temperature, but any other solution variable that is usually available in the Ansys Chemkin Visualizer can be selected instead.
Within the graph that displays the selected Y Variable plotted as a function of the independent variable, an "X" location for the solution can be selected. Clicking inside of the X-Y plot window, shown in Figure 4.11: Data Selection window, will set the point of interest, and a new Reaction Path Diagram will be generated for that location. In addition, pressing the right or left arrows on your keyboard will increment or decrement the point of interest by one stored solution point, when the Control Panel is in focus on your screen. This allows finer control of the location. By default, the location selected is at the start of the solution, for example, at X (time or distance)=0.0. The location selected, in terms of (X,Y) values is displayed below the graph.