VM80
VM80
Plastic Response to a Suddenly Applied Constant Force
Test Case
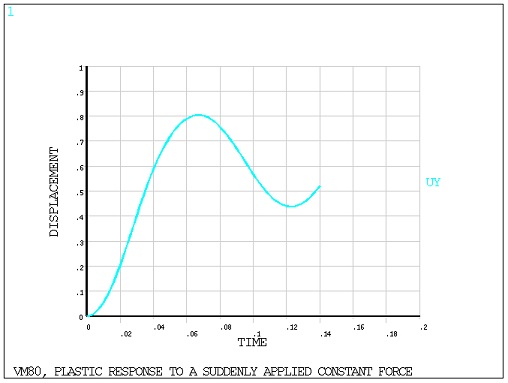
A mass m supported on a thin rod of area A and length
 is subjected to the action of a suddenly applied
constant force F1. The stress-strain curve
for the rod material is shown below. Determine the maximum deflection
ymax and minimum deflection ymin of the mass, neglecting the mass of the rod.
is subjected to the action of a suddenly applied
constant force F1. The stress-strain curve
for the rod material is shown below. Determine the maximum deflection
ymax and minimum deflection ymin of the mass, neglecting the mass of the rod.
Analysis Assumptions and Modeling Notes
The initial integration time step (0.004/10 = 0.0004 sec) is
chosen small enough to allow the initial step change in acceleration
to be followed reasonably well. The final integration time step ((0.14-.004)/68
= 0.002 sec) is based on
 1/60 of
the period to produce sufficient printout for the theoretical comparison.
The final time of 0.14 sec allows slightly more than 1 cycle of vibration
to be followed. POST26 is used to extract results from the solution
phase.
1/60 of
the period to produce sufficient printout for the theoretical comparison.
The final time of 0.14 sec allows slightly more than 1 cycle of vibration
to be followed. POST26 is used to extract results from the solution
phase.
Results Comparison
Mechanical APDL printout does not occur
at theoretical time point given. Comparison (ratio) is therefore
made with closest Mechanical APDL time and theoretical time point given.
Based on graphical values.