VM65
VM65
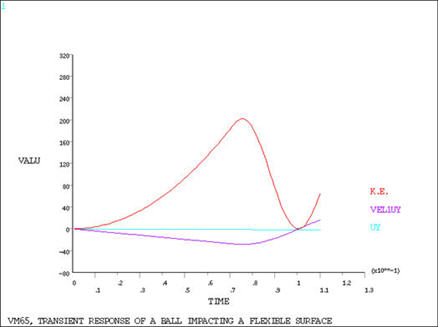
Transient Response of a Ball Impacting a Flexible Surface
Overview
Test Case
A rigid ball of mass m is dropped through a height h onto a flexible surface of stiffness k. Determine the velocity, kinetic energy, and displacement y of the ball at impact and the maximum displacement of the ball.

| Material Properties | Geometric Properties | Loading | ||||
|---|---|---|---|---|---|---|
|
|
|
Analysis Assumptions and Modeling Notes
The node locations are arbitrarily selected. The final time
of 0.11 seconds allows the mass to reach its largest deflection.
The integration time step (0.11/110
 0.001 sec) is based on
 1/100
of the period (during impact), to allow the initial step acceleration
change to be followed reasonably well and to produce sufficient printout
for the theoretical comparison. At release h, the mass acceleration
is 386 in/sec2. Therefore, a load step
with a small time period is used to ramp to the appropriate acceleration
while maintaining essentially zero velocity. Displacements and velocities
are listed against time in POST26 and stored kinetic energy is obtained
in POST1.
1/100
of the period (during impact), to allow the initial step acceleration
change to be followed reasonably well and to produce sufficient printout
for the theoretical comparison. At release h, the mass acceleration
is 386 in/sec2. Therefore, a load step
with a small time period is used to ramp to the appropriate acceleration
while maintaining essentially zero velocity. Displacements and velocities
are listed against time in POST26 and stored kinetic energy is obtained
in POST1.
The model is solved using the node-to-surface CONTA175 element.