VM150
VM150
Moisture Diffusion in a Plate Under Constant Surface Concentration
Test Case
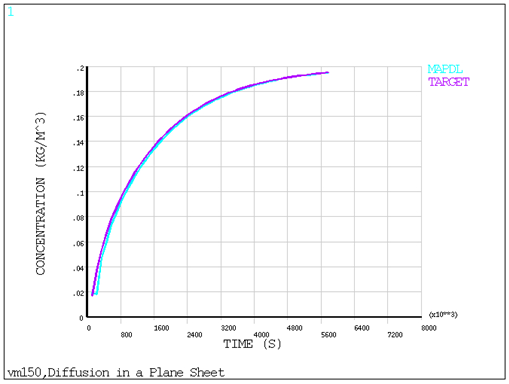
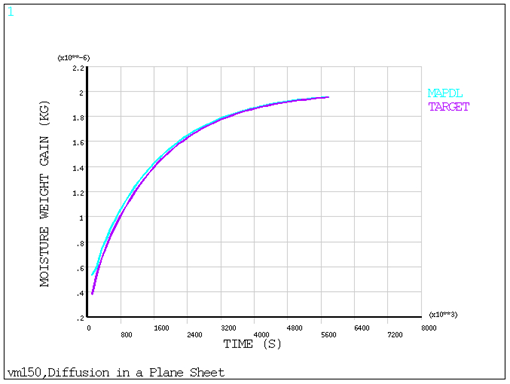
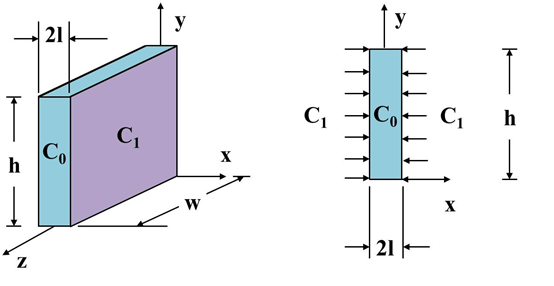
A plane sheet of thickness 2l at an initial concentration C0 is subjected to an applied concentration of C1 at its surface (x = ± l). A time transient analysis (ANTYPE = 4) is performed with a run time of t=5760000s to determine the moisture concentration in the plane sheet at location x=l/2 and at time=t/2. Also the total moisture weight gain is determined at time=t/2.
| Material Properties | Geometric Properties | Loading |
|---|---|---|
|
Diffusivity coefficient D = 1e-12 m2/s |
l = 2e-3 m w = 50e-3 m h = 50e-3 m |
C0 = 0.01 kg/m3 C1 = 0.2 kg/m3 |
Analysis Assumptions and Modeling Notes
The initial concentration C0 is applied using the IC command, and the concentration C1 is applied using the D command. The transient analysis is run with stepped loading (KBC=1).
To calculate the moisture weight gain, the concentration of each element is multiplied by the element’s volume. These individual element weight gains are then summed to give the total weight gain.
The target concentration solution was obtained using Eq. 4.17 given in the reference. The equation was truncated to five terms for target result calculation:

Where:
x = X-location in plate. The value l/2 was used.
The target moisture weight gain solution was obtained using Eq. 4.18 given in the reference. The equation was truncated to five terms for target result calculation:

Where:
M∞ = the total moisture weight gain at saturation. This was assumed to be: