


Following is a plot of the sound pressure level (SPL) on the full model:
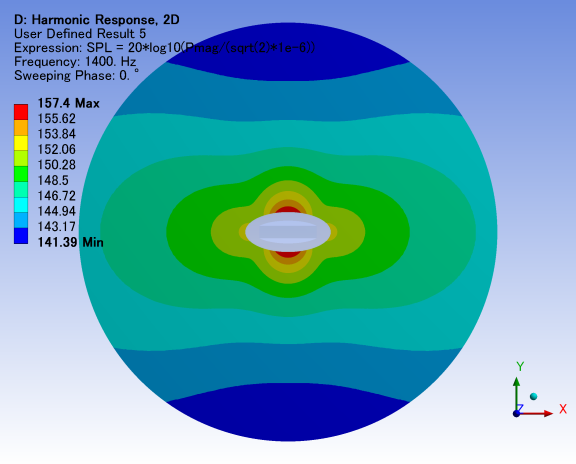
Notice that while the maximum SPL is at the surface of the transducer’s minor axis, the SPL near the truncated boundary is lower along the minor axis.
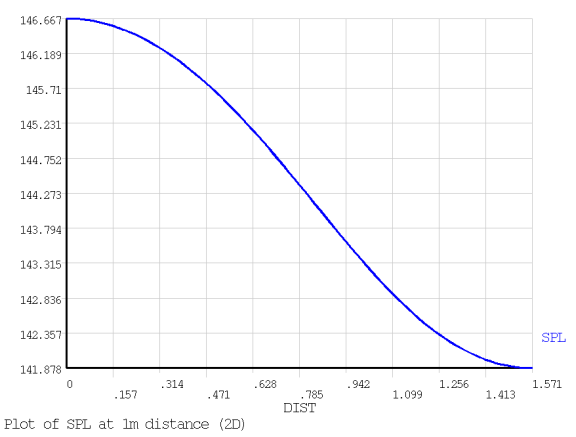
This SPL plot along an arc 1 m from the center shows the direction of the arc from the x axis towards the y axis:

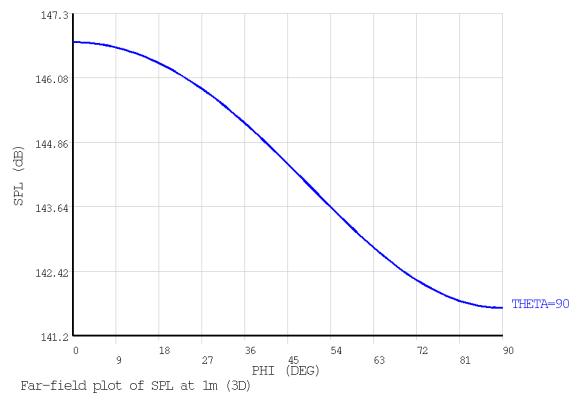
The following figures show the 2D and 3D plots followed by the two plots overlaid:
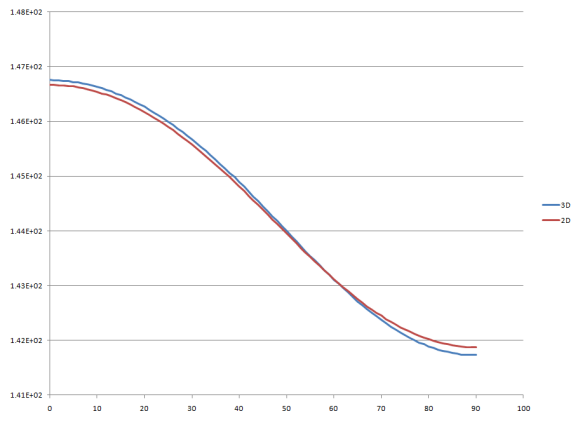
The plot overlay indicates good correlation between the 2D and 3D models.
Note: The meshes for both cases were not identical, so some variation in the results was expected.