6.7. Results and Discussion

The following figure shows the temperature distribution in the solid region. As expected, the blade is cooler near the holes.

Figure 6.4: Solid Region Temperature Distribution

Solid Region Temperature Distribution

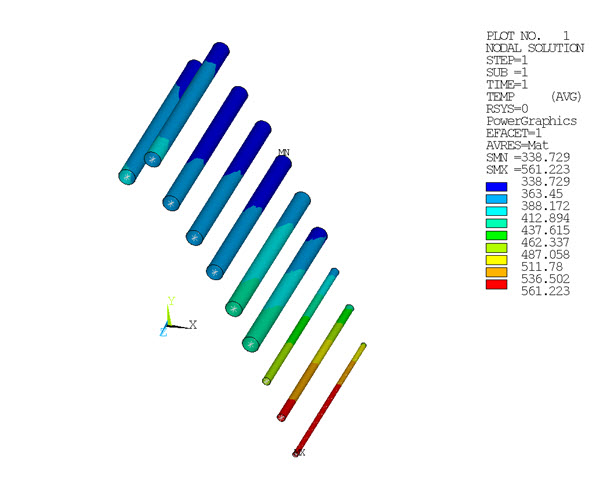
The following two figures show the fluid and solid surface temperatures, respectively. The fluid temperature rises from inlet to outlet. The solid surface temperature shows a similar trend.

Figure 6.5: Fluid Temperatures

Fluid Temperatures

Figure 6.6: Solid Surface Temperatures

Solid Surface Temperatures

The following two XY plots show the fluid and solid temperatures, respectively, along the fluid path of hole number 1.

Figure 6.7: Fluid Temperature Along Path of Hole Number 1

Fluid Temperature Along Path of Hole Number 1

Figure 6.8: Solid Temperature Along Path of Hole Number 1

Solid Temperature Along Path of Hole Number 1

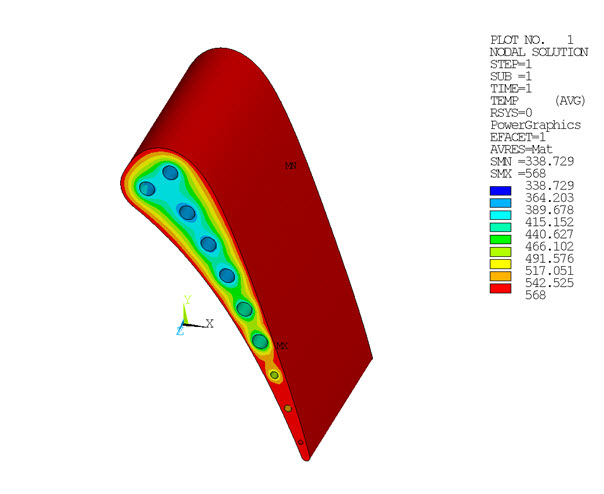
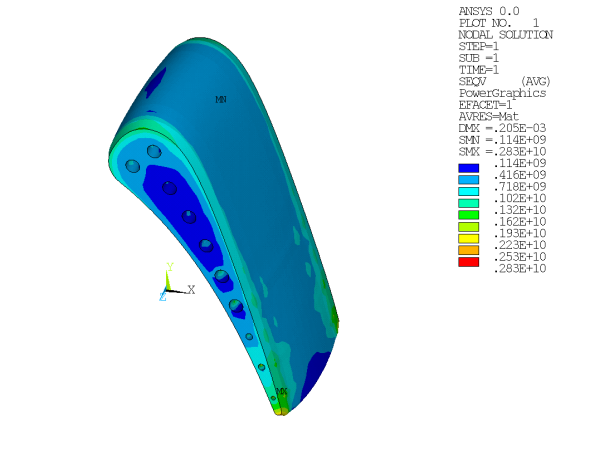
The next figure shows the von Mises stresses for the solid region. Maximum stresses occur inside hole number 10.

Figure 6.9: Von Mises Stresses for Solid Region

Von Mises Stresses for Solid Region

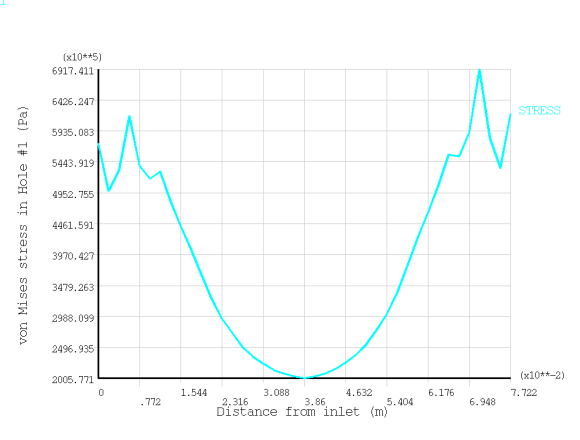
The following XY plot shows the stress variation in hole 1.

Figure 6.10: Von Mises Stress Along Path of Hole Number 1

Von Mises Stress Along Path of Hole Number 1