The time-history response shows changes to the tire's internal air pressure, volume, density and mass during each load step.
A comparison to the expected results (obtained via an analytical solution) validates the simulation of the air using the hydrostatic fluid element HSFLD242.
The volume of the gas inside the tire is defined by the underlying solid, so it is considered a given. Expected pressure, density, and mass are calculated as follows:
| Density: | ρf = ρo * Pf / Po |
| Pressure: | Pf = Po * Vo / Vf when mass is constant during load step |
| Mass: | mass = density * volume |
The following table shows the expected results at each load step:
| Time (Sec) | Pressure (N/mm2) | Volume (mm3) | Density (Kg/mm3) | Mass (Kg) |
|---|---|---|---|---|
| 1 | 0 | 0.326285E+08 | 0.1225E-11 | 0.3997E-04 |
| 2 | 0.248213 | 0.329565E+08 | 0.4219E-11 | 0.139E-03 |
| 3 | 0.248213 | 0.327078E+08 | 0.4219E-11 | 0.1379E-03 |
| 4 | 0.253812 | 0.319862E+08 | 0.43141E-11 | 0.1379E-03 |
| 5 | 0.252676 | 0.321300E+08 | 0.42947E-11 | 0.1379E-03 |
Hydrostatic pressure can be output as the HDSP degree-of-freedom solution. The NMISC output quantities (TVOL, DENSITY, and TMAS) provide results for the entire fluid volume, so all hydrostatic fluid elements sharing the pressure node have the same output value.
The following table shows the simulation results at each load step:
| Time (Sec) | Pressure - HDSP (N/mm2) | Volume - TVOL (mm3) | Density - DENSITY (Kg/mm3) | Mass - TMAS (Kg) |
|---|---|---|---|---|
| 1 | .967073E-5 | 0.326285E+08 | 0.12251E-11 | 0.3997E-04 |
| 2 | 0.248213 | 0.329565E+08 | 0.42189E-11 | 0.1390E-03 |
| 3 | 0.248213 | 0.327078E+08 | 0.42189E-11 | 0.1379E-03 |
| 4 | 0.256104 | 0.319862E+08 | 0.43140E-11 | 0.1379E-03 |
| 5 | 0.254482 | 0.321300E+08 | 0.42945E-11 | 0.1379E-03 |
The following figures shows the condition of the inside air and its effect on the axle through each load step:
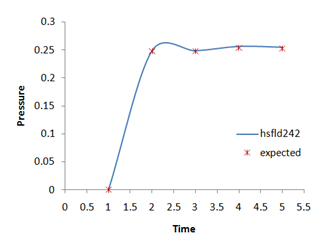
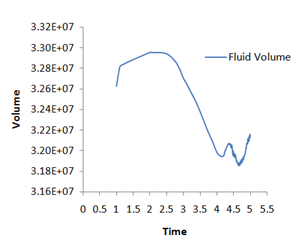
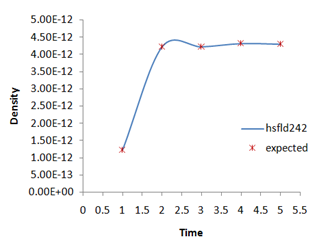
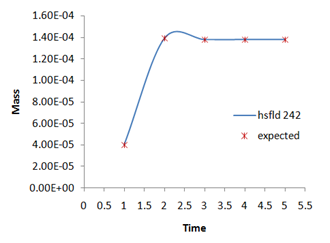
Most importantly, the figures indicate a good agreement with the expected results, validating the use of hydrostatic fluid element HSFLD242 to model the air inside of the tire.