To understand the dependence of maximum surface subsidence on reservoir size and depth, the following simulation cases are examined:
| Case | η(=D/R) | H (in ft) |
| #1 | 1.0 | 100 |
| #2 | 0.5 | 100 |
| #3 | 0.2 | 100 |
| #4 | 0.1 | 100 |
| #5 | 1.0 | 150 |
| #6 | 1.0 | 200 |
| #7 | 1.0 | 250 |
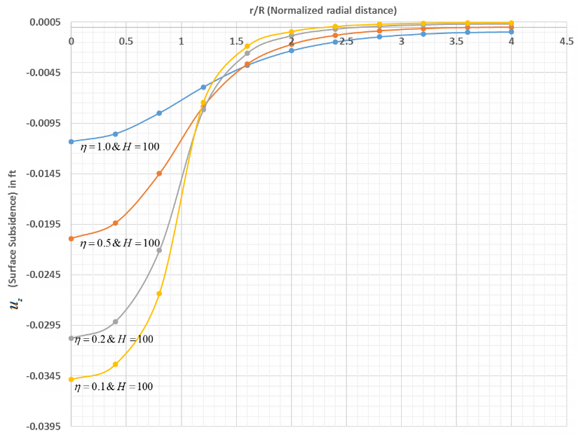
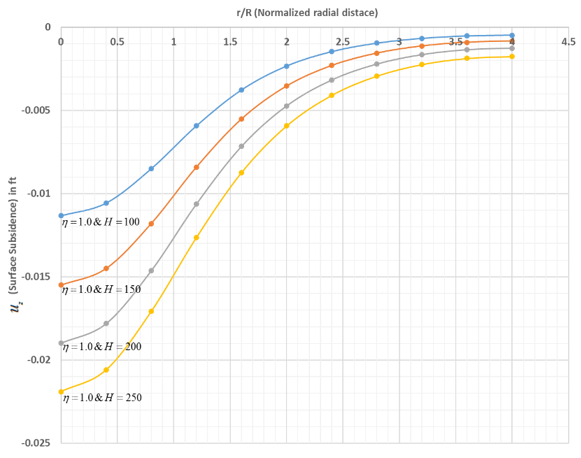
As shown in the following two figures, the normal surface displacement for various values of η(=D/R) and H are plotted as a function of radial distance normalized with the radius of the reservoir:
The maximum subsidence occurs at origin and decays rapidly to zero at a distance of about four times the radius of the reservoir.
Geertsma[1] (Eq. 6) shows analytically that the maximum subsidence is a quadratic function of η(=D/R) and a linear function of reservoir height (H):
As shown in the following figure, the numerical results of this example problem match the analytical trends very well:
Figure 46.5: Maximum Subsidence as a Quadratic Function of η(=D/R) and a Linear Function of Reservoir Height (H)
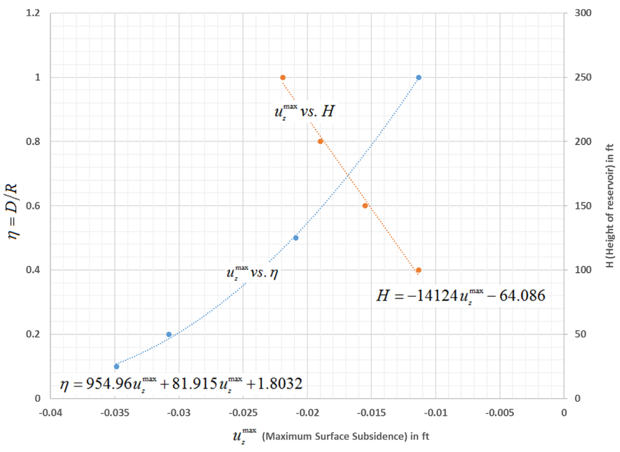
The results indicate that subsidence increases rapidly with a decrease in reservoir depth as compared to an increase in reservoir height.
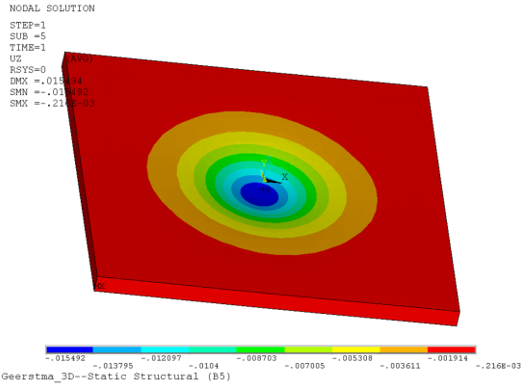
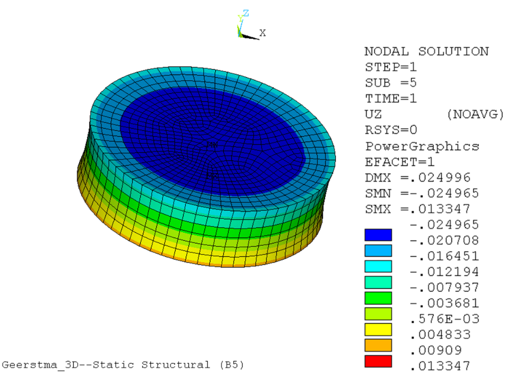
The following two figures show typical contour plots for surface subsidence and reservoir compaction, respectively:


