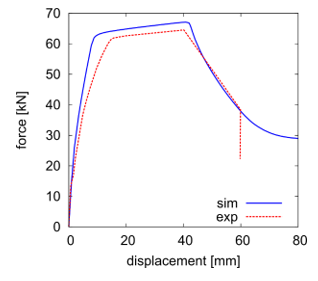
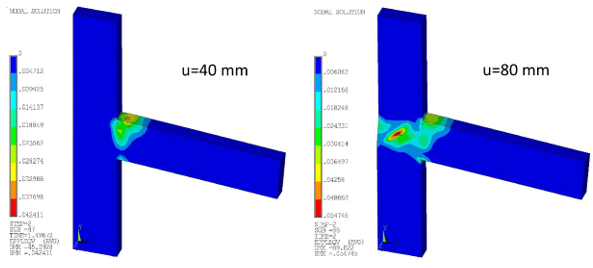
The following figure shows the resulting force displacement curve (sim) and compares it to the experimental results (exp). After a period of hardening, softening occurs.
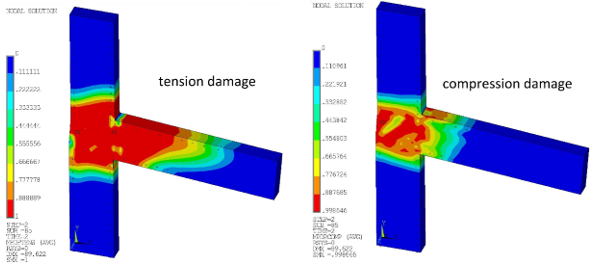
The softening is caused by a strong evolution of plasticity and compression damage in the middle of the joint:
Although the failure starts as a tensile cracking at the top left side of the beam, it changes at higher deformation to shear banding in the common column-beam area.
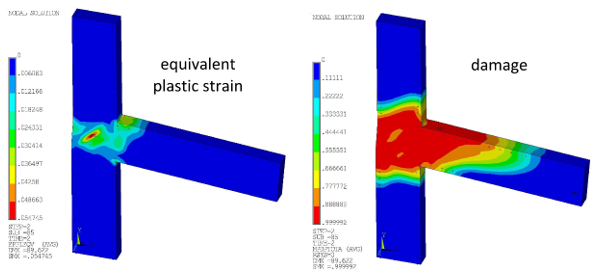
Observe that plasticity tends to localize in a narrower zone than the damage, which is more diffused and extends outside the plastic zone:
The plasticity and damage results are in agreement with the formulation where the gradient enhancement is applied for the damage part only. Within this framework, the damage can be interpreted as the microcracking spread over a larger zone, while the plasticity represents the macrocrack emerging at the center of the damage zone.
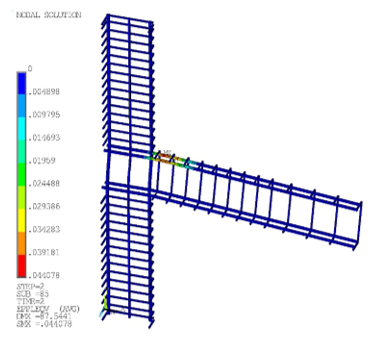
Considering the deformed shape and the plastic strain in the steel reinforcing, it is obvious that the deformation in the rebars is concentrated in the region with the maximum tensile stress:


