


An analysis of a structure excited by uniform base motion is a common task usually performed using tools such as response spectrum analysis (RSA). Accounting for ground motion incoherency effects requires additional modeling effort and computational resources, the benefit being a reduction of the response at the spectrum high frequency. This example demonstrates the determination of the reduction ratio using PSD analysis.
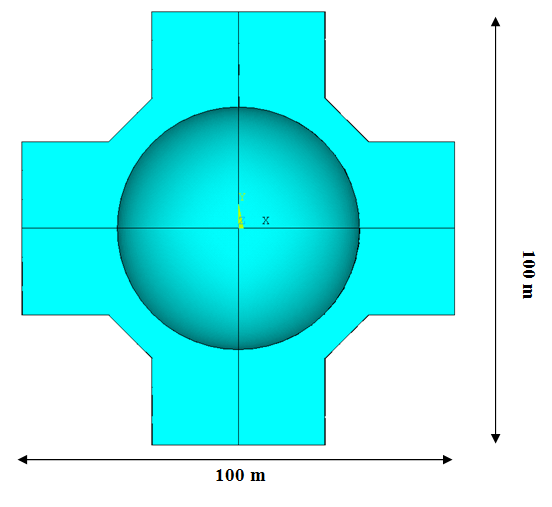
A nuclear island (NI) component of a typical modern nuclear power plant (NPP) is modeled. The model consists of one reactor building and four auxiliary buildings, all located on a single basemat. Each building encompasses five floor levels. Overall plan dimensions are 100 x 100 m2. The building height range is 40-50 m.
The structure is excited by a typical base motion generated by a nearby fault. The event generates a high-amplitude, short-duration, high-frequency quake. Such loading is commonly applied in the form of a ground motion response spectrum (GMRS), which provides the peak response of a series of single-degree-of-freedom (SDOF) systems. The GMRS selected by Xu and Samaddar [1] is used here and is shown in the following figure:
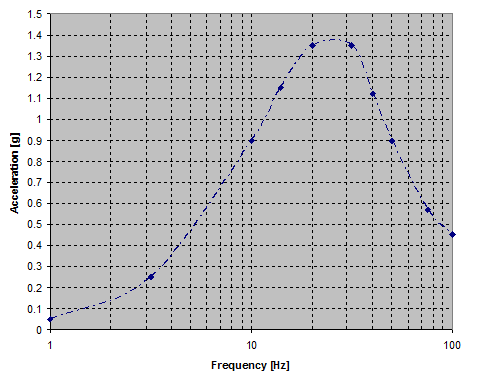
The GMRS typical of eastern United States sites is characterized by a high energy content in the high-frequency range (>10 Hz).
The GMI effects on responses can be incorporated using either the stochastic approach or the deterministic approach.[6] The deterministic approach is used here. The following coherency functions describe the relationship between ground motions at separate locations as a function of the separation distance and the frequency of the ground motion:[2]
The lagged coherency function.
The plane-wave coherency function.
The unlagged coherency function.
The plane-wave coherency function is used for this example, as it applies to rock-like soil conditions. The function is expressed as:

where γpw is the plane wave coherency representing the random horizontal spatial variation of ground motion, F is the ground motion frequency, ξ is the separation distance between locations in meters, and tanh is the hyperbolic tangent function. All other parameters are given in the following table for horizontal and vertical ground motion:
Table 34.1: Coherency Function Coefficients
| Coefficient | Horizontal Ground Motion | Vertical Ground Motion |
|---|---|---|
| a1 | 1.647 | 3.15 |
| a2 | 1.01 | 1.0 |
| a3 | 0.4 | 0.4 |
| n 1 | 7.02 | 4.95 |
| n 2 | 5.1 – 0.51ln(ξ + 10) | 1.685 |
| f c | -1.886 + 2.221ln(4000 / (ξ + 1) +1.5) | exp[2.43 - .025ln(ξ + 1) - 0.048 (ln(ξ + 1))2] |
Coherency functions are plotted as a function of frequency for various separation distances, as shown in Figure 34.5: EPRI-TR 1014101 -- Plane Wave Coherency Model for Horizontal Direction.