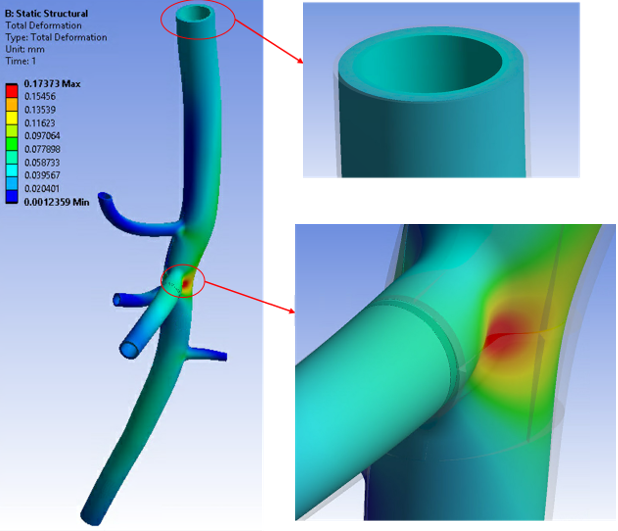
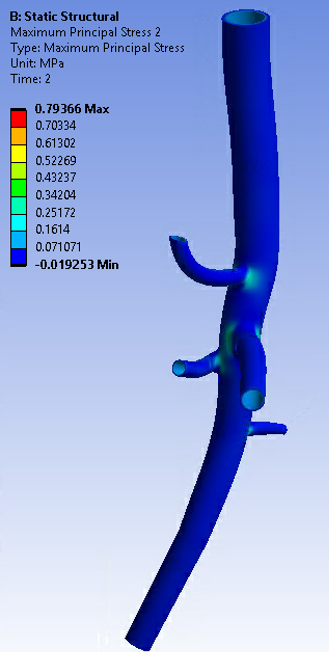
The deformed shape of the abdominal aorta model after the first load step is the zero-pressure geometry:
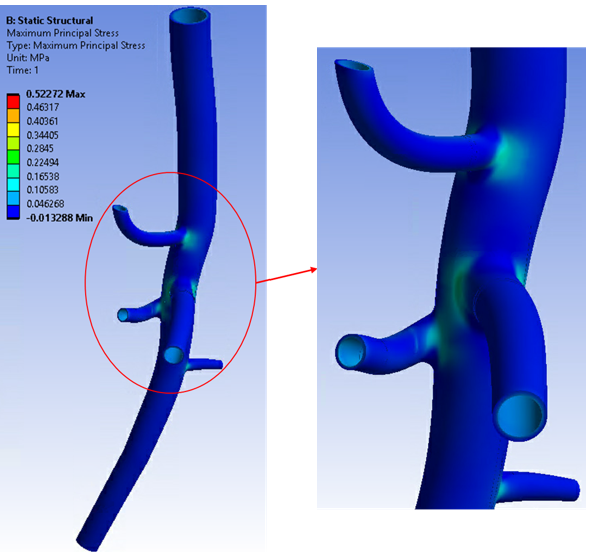
In addition to the zero-pressure geometry, the inverse-solving load step also gives the stress/strain results of the input geometry at end-diastolic pressure (80 mm Hg):
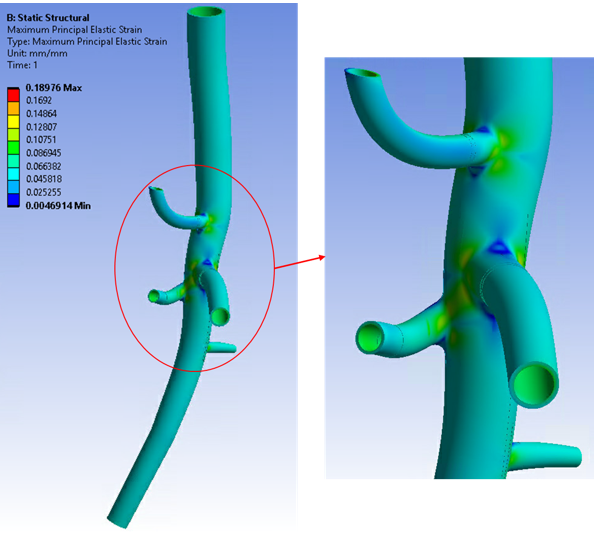
In the second load step, the analysis is continued via forward solving (INVOPT,OFF) and the pressure load is increased until it reaches end-systolic pressure (120 mm Hg):
Figure 62.11: Maximum Principal Strain Plot of the Abdominal Aorta Model at End-Systolic Pressure (120 mm Hg)
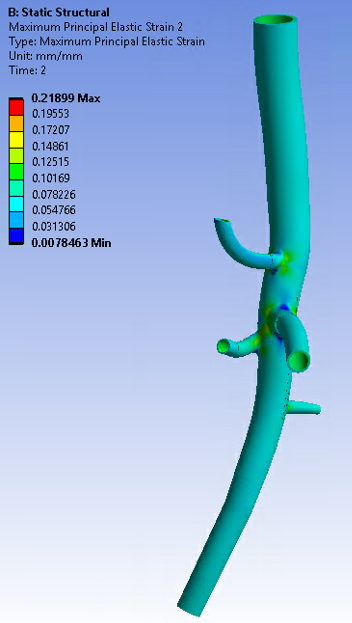
For comparison purposes only, the following figure shows one of the cross-sections in the proximal abdominal aorta at zero-pressure, end-diastolic pressure, and end-systolic pressure conditions:
Figure 62.12: Deformation of Cross-Section at the Proximal Abdominal Aorta Location for Various Pressure Conditions
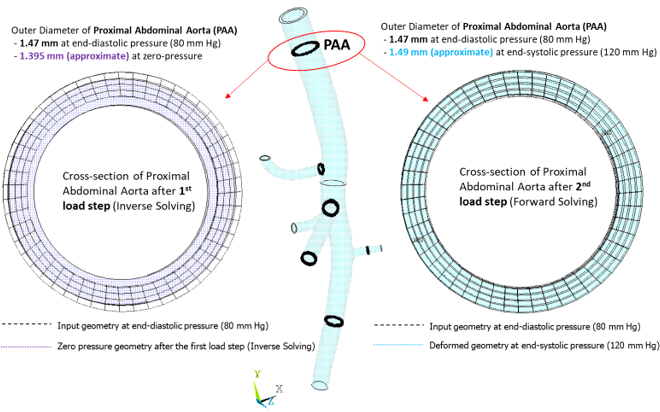
The input geometry is considered at end-diastolic pressure (80 mm Hg), the deformed geometry after the first load step (inverse solving) is at zero-pressure, and the deformed geometry after the second load step is at end-systolic pressure (120 mm Hg). The outer diameters of the cross-section in deformed states are approximately calculated by creating a local cylindrical coordinate system at the approximate center of the deformed cross-section.
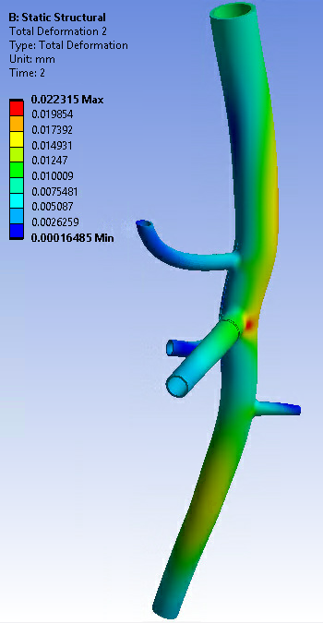
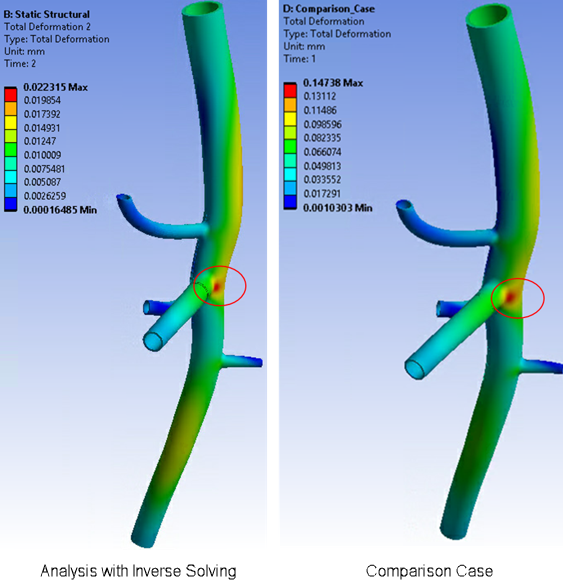
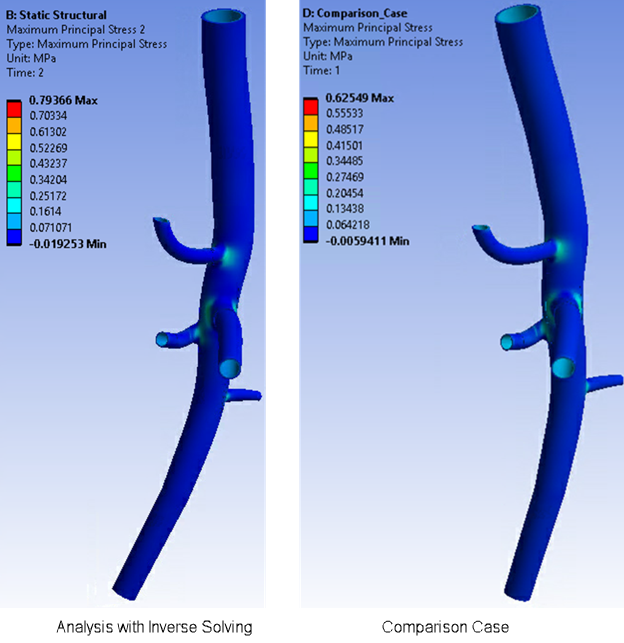
The following figures highlight the results accuracy of this simulation using inverse solving vs. a simulation solved for the same model without accounting for the prestressed effect. In a comparison case, the input geometry is assumed to be the zero-pressure geometry, and a forward-solving analysis is performed with end-systolic pressure (120 mm Hg) in only one load step:
In the comparison case, the maximum total deformation at one of the junctions is higher than that of the simulation using inverse solving.
When using the inverse-solving method to account for the input geometry at end-diastolic pressure (80 mm Hg) and prestress effects, the actual maximum total deformation is much lower.


