


The following figure shows the total reaction force versus the maximum vertical displacement at the center of the concrete slab for both concrete material models:
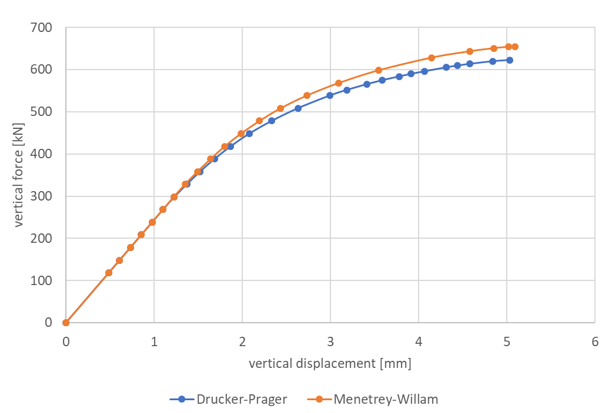
A maximum total force of approximately 610 kN (using Drucker-Prager) or 655 kN (using Menetrey-Willam) can be applied when the structure collapses at a maximum deflection of approximately 5.0 mm (Drucker-Prager) or 5.1 mm (Menetrey-Willam). The loss of structural integrity can be identified at these load limits by the horizontal tangent of the force/displacement curve.
Figure 49.5: Vertical Displacements (Drucker-Prager): Concrete Slab After Applying Dead Load and Load Limit (Top View)
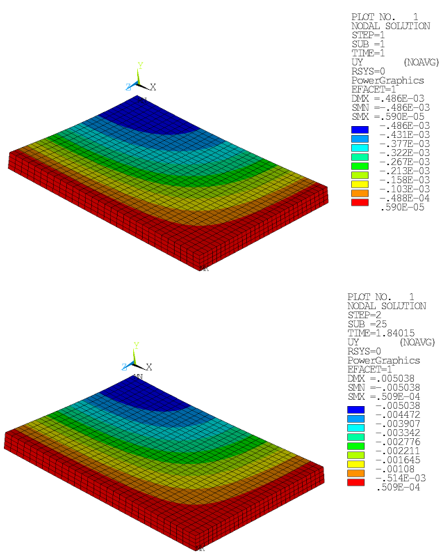
Figure 49.6: Vertical Displacements (Menetrey-Willam): Concrete Slab After Applying Dead Load and Load Limit (Top View)
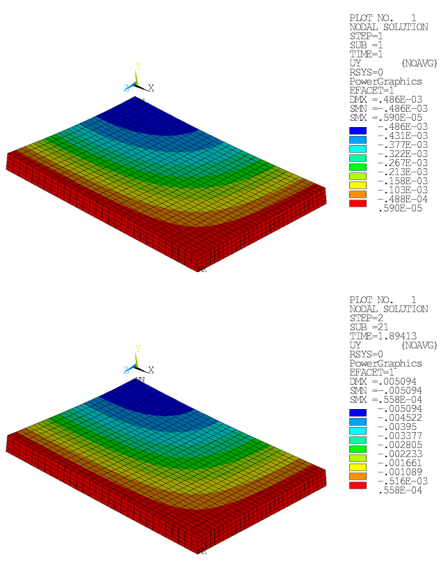
The application of the load limit results in an ultimate displacement approximately ten times larger than the at-rest deformation state. For both loading conditions, the maximum displacement is found in the center, consistent with theoretical assumptions.
The following figures show that the large structural deformations for the load-limit step result in high internal stresses for the concrete base matrix:
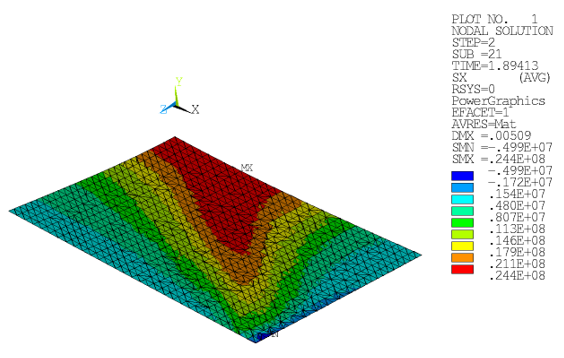
Figure 49.7: Horizontal Stress Component SX (Drucker-Prager): Concrete Slab at Ultimate Limit Load (Top and Bottom View)
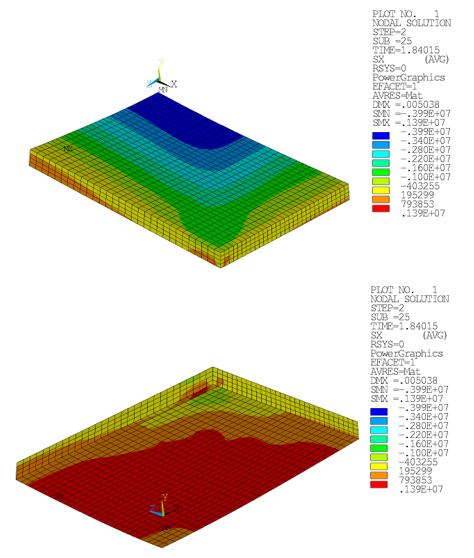
Figure 49.8: Horizontal Stress Component SX (Menetrey-Willam): Concrete Slab at Ultimate Limit Load (Top and Bottom View)
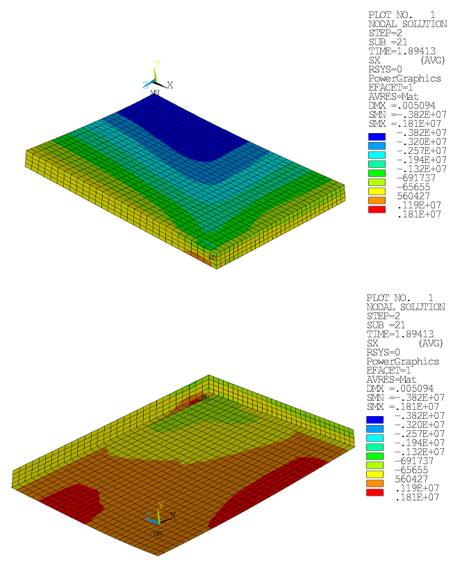
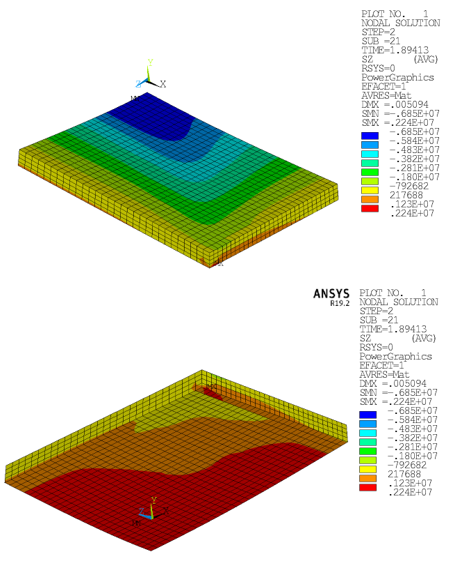
Figure 49.9: Horizontal Stress Component SZ (Drucker-Prager): Concrete Slab at Ultimate Limit Load (Top and Bottom View)
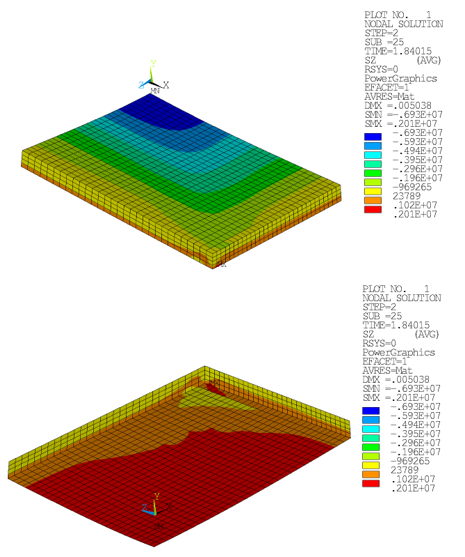
Figure 49.10: Horizontal Stress Component SZ (Menetrey-Willam): Concrete Slab at Ultimate Limit Load (Top and Bottom View)
Bending movement leads to compressive stresses on the top side of the concrete slab, and tensile stresses in the bottom region.
In the following figure, the reinforcing elements have been added:
Figure 49.11: Stress Components SX (Drucker-Prager): Steel Reinforcing at Ultimate Load Limit (Top View)
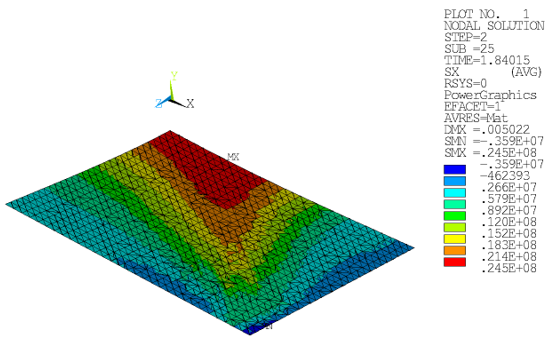
Figure 49.12: Stress Components SX (Menetrey-Willam): Steel Reinforcing at Ultimate Load Limit (Top View)
The steel reinforcing supports the composite structure by carrying part of the loading.
The increasingly large tensile stresses in the concrete domain lead to crack formation, as indicated by the equivalent plastic strains:
Figure 49.13: Equivalent Plastic Strains (Drucker-Prager): Concrete Slab at Ultimate Limit Load (Bottom View)
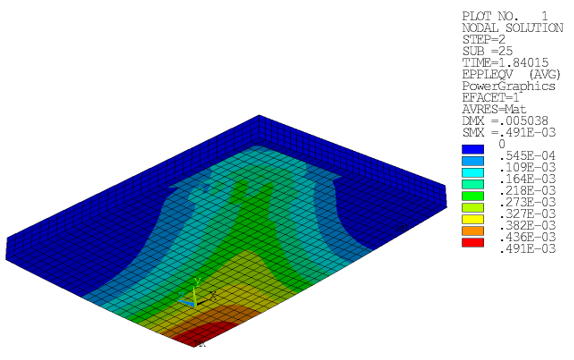
Figure 49.14: Equivalent Plastic Strains (Menetrey-Willam): Concrete Slab at Ultimate Limit Load (Bottom View)
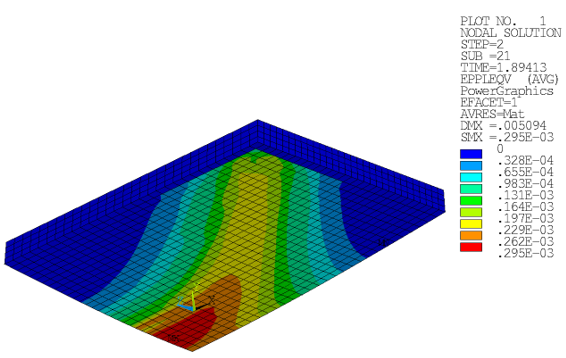
The crack pattern forms in the center and spreads toward the outermost edge.
The loss of structural integrity due to crack formation leads to the collapse of the structure for the indicated load limit of 620 kN (Drucker-Prager) or 655 kN (Menetrey-Willam).