


A comparative study of all three methods shows the effectiveness and simplicity of the bolt section method.
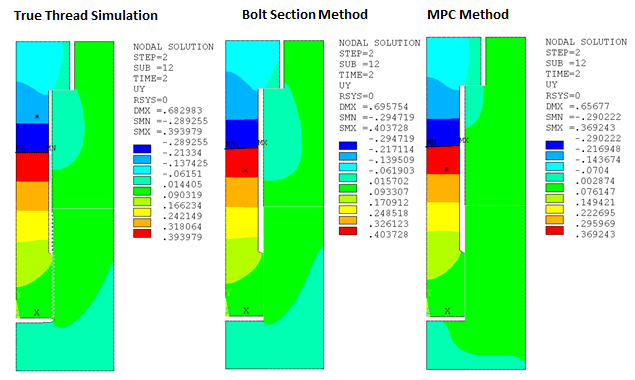
Axial (UY) Displacement
The pretension effects can be observed in the following figure in which two segments of the bolt are pulling against each other.
von Mises Stress
The von Mises stress plots below show that shank stress is similar in all three methods. User-specified contour values are used for the purpose of comparison. Variations are observed only in the local areas such as the thread region or near the bolt head and cover plate contact region.
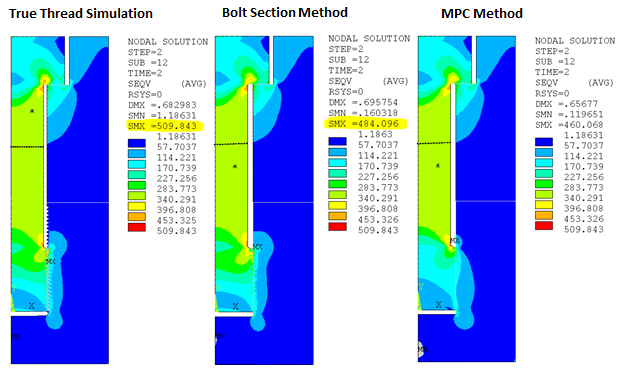
The stress plot of the thread region for the bolt section method closely matches the stress plot for the true thread simulation, and the MPC method plot varies. The comparison between stress plots demonstrates that accurate simulation of thread behavior and shank stress in the bolt can be achieved by using the bolt section method.
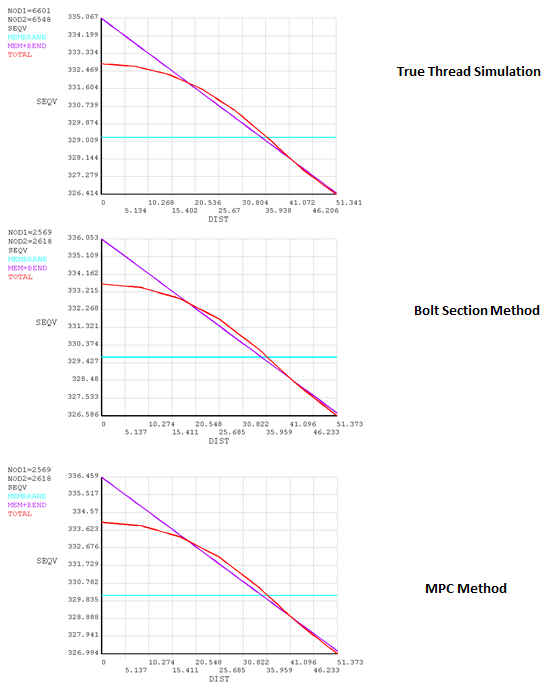
Linearized Stress Along a Path
Linearized stress in the bolt shank along the path at y = 280 is similar for all three methods. The values are 329.2 MPa for the true thread simulation, 329.7 MPa for the bolt section method, and 330.10 MPa for the MPC method.
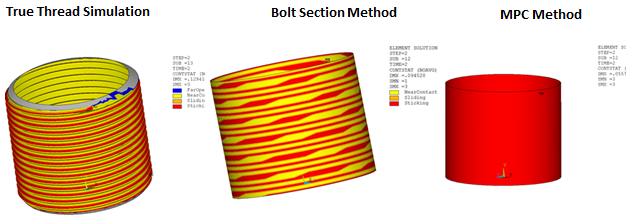
Contact Status
A helix pattern can be observed in the contact status plot of the bolt section method. If the mesh is sufficiently refined in the thread region, a more accurate helix pattern can be obtained.
Axial (UY) Displacement
The pretension effects can be observed in the following figure in which two segments of the bolt are pulling against each other.
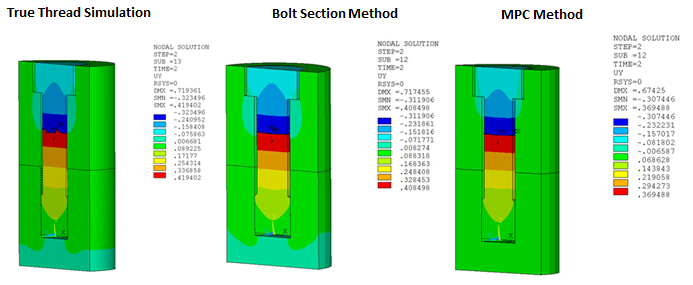
von Mises Stress
Similar to the 2D case, the von Mises plots for the 3D models show that shank stress is similar in all three methods, and variations are observed only in the local areas.
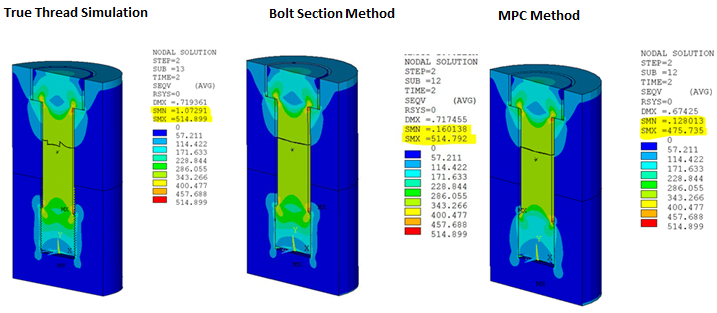
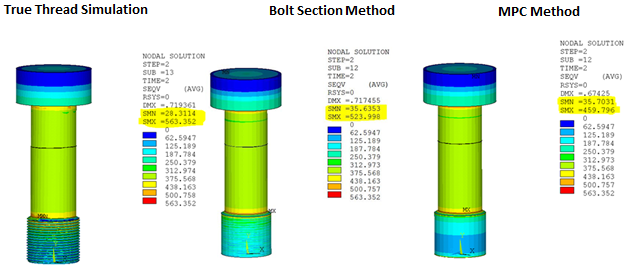
The stress plot of the thread region for the bolt section method closely matches the stress plot for the true thread simulation, and the MPC method plot varies. This validates the conclusion that the bolt section method achieves accuracy near to that of the true thread simulation.
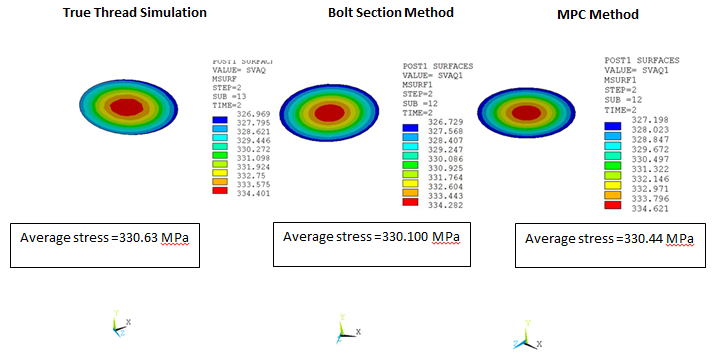
von Mises Stress at Section
Average von Mises stress in the bolt shank at section y = 280 is similar for all three methods. The values are 330.63 MPa for the true thread simulation, 330.10 MPa for the bolt section method, and 330.44 MPa for the MPC method.
From the tables below it is clear that the bolt section method is less computationally expensive than the true thread simulation. The MPC method is the least computationally expensive, but thread effects are lost.
Table 37.3: Simulation Time and Cumulative Iterations for 2D Models
| Computation time | Elapsed time | Cumulative iterations | Number of Elements | |
| True thread simulation | 182.942 | 186 | 31 | 12642 |
| Bolt section method | 38.439 | 41 | 28 | 2297 |
| MPC method | 35.646 | 38 | 28 | 2297 |
Table 37.4: Simulation Time and Cumulative Iterations for 3D Models
| Computation time | Elapsed time | Cumulative iterations | Number of Elements | |
| True thread simulation | 731625.968 | 415326 | 29 | 1111133 |
| Bolt section method | 44451.254 | 45912 | 25 | 69061 |
| MPC method | 41255.852 | 41948 | 25 | 69061 |
Comparisons of von Mises stress and computation time demonstrate that accurate simulation of thread behavior and shank stress results in the bolt can be achieved by the bolt section method, with the added benefit of significant savings of simulation time.