You can graph the function you enter and see a visual representation of the current function, or you can list results of the equation. Graphing and listing allow you to easily verify that your equation is behaving as you expect.
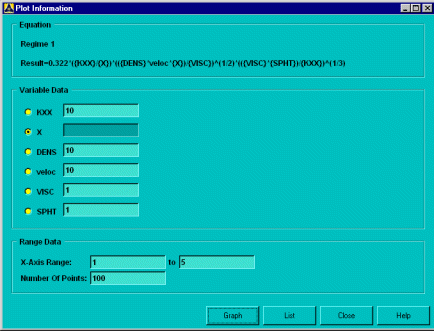
For either graphing or listing, select a variable to graph the result against, and set an x-axis range and the number of points to graph.

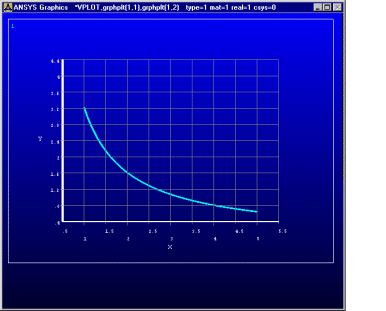
From the Plot Information dialog box, click after you set up your plot. An example of a plot is shown below.

You can apply any standard graph functionality. (For example, fill in under curve using the command input window or via the GUI .) You can also save an image for later use.
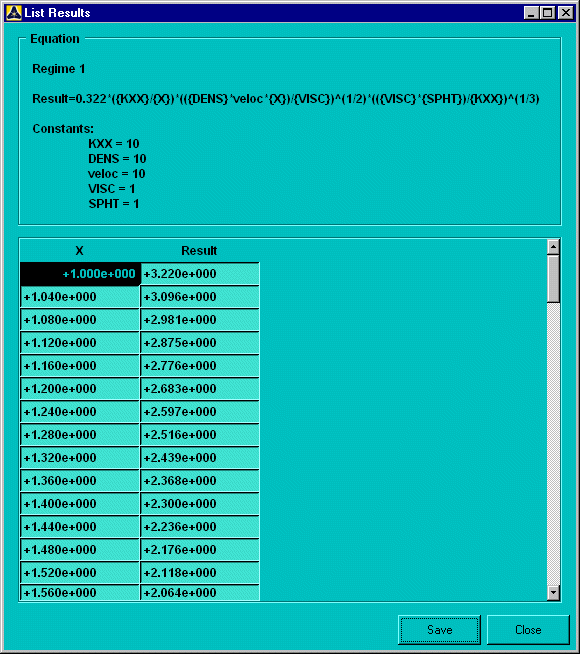
To generate a table displaying the plot point values, select the List option from the Plot Information dialog box. The settings you chose in the Plot Information dialog box are used to generate the values. An example of such a table follows:

You cannot edit the table, but you can copy and past it into a spreadsheet. You can also save the information to a text file; the file will contain all equation data and calculated coordinates.


