Two postprocessors are available for reviewing your results: POST1, the general postprocessor, and POST26, the time-history postprocessor.
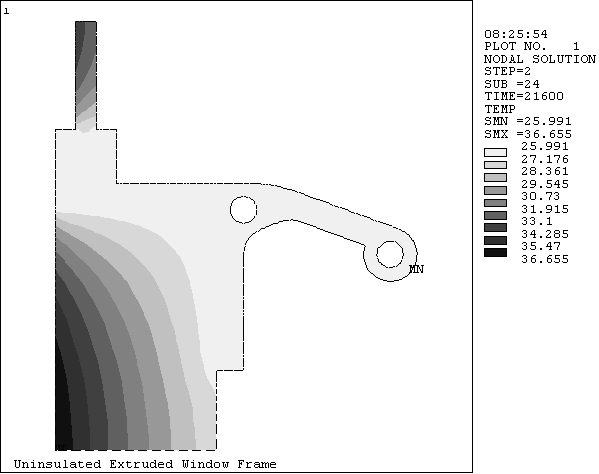
POST1 allows you to review the results over the entire model at specific load steps and substeps (or at specific time-points or frequencies). In a static structural analysis, for example, you can display the stress distribution for load step 3. Or, in a transient thermal analysis, you can display the temperature distribution at time = 100 seconds. Following is a typical example of a POST1 plot:
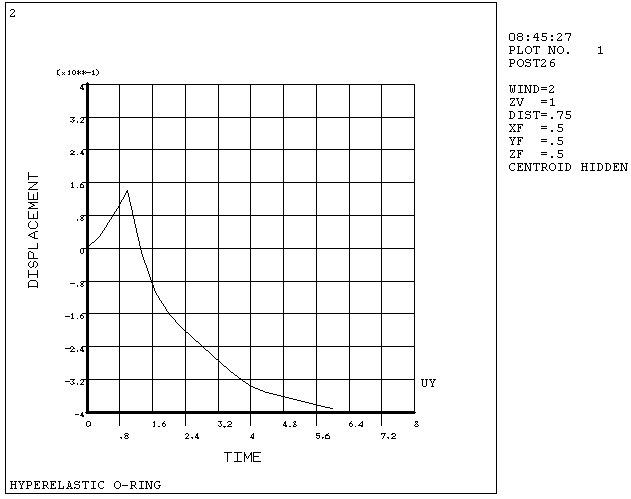
POST26 allows you to review the variation of a particular result item at specific points in the model with respect to time, frequency, or some other result item. In a transient magnetic analysis, for instance, you can graph the eddy current in a particular element versus time. Or, in a nonlinear structural analysis, you can graph the force at a particular node versus its deflection. Figure 6.2: A Typical POST26 Graph is shown below.
The postprocessors are tools for reviewing analysis results. You must still use your engineering judgment to interpret the results. For example, a contour display may show that the highest stress in the model is 37,800 psi. It is your responsibility to determine whether this level of stress is acceptable for your design.


