Under Transient Thermal > Solution, click Temperature to view the temperature results. (Note that the Temperature object under Solution Information shows only a snapshot of results whereas the Temperature object under Solution shows the full thermal history when the thermal solve is complete.)
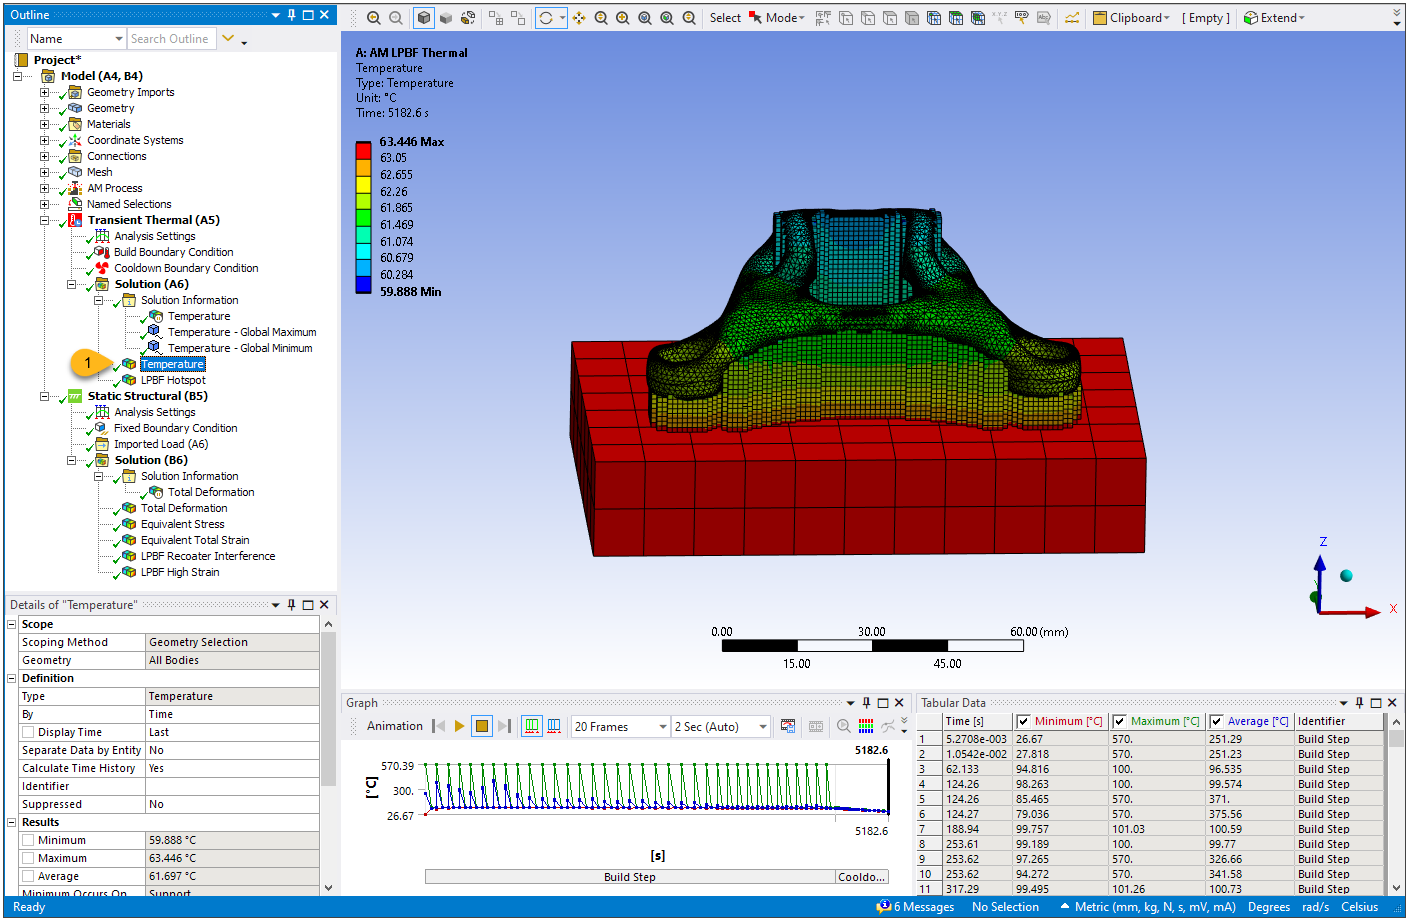
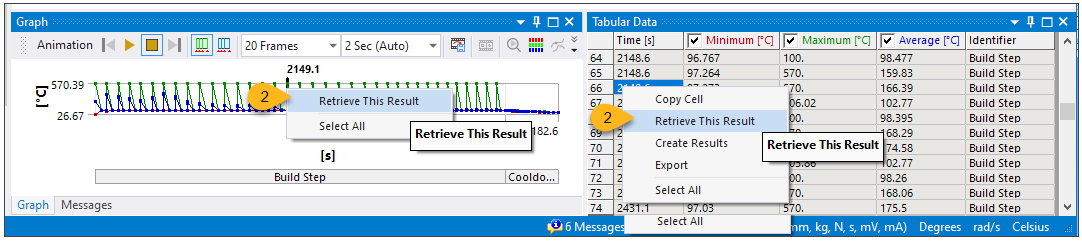
To view the result at different time steps, right-click anywhere within the time graph located at the bottom left corner of the screen, or at any time in the tabular data at the bottom right, and select Retrieve This Result.
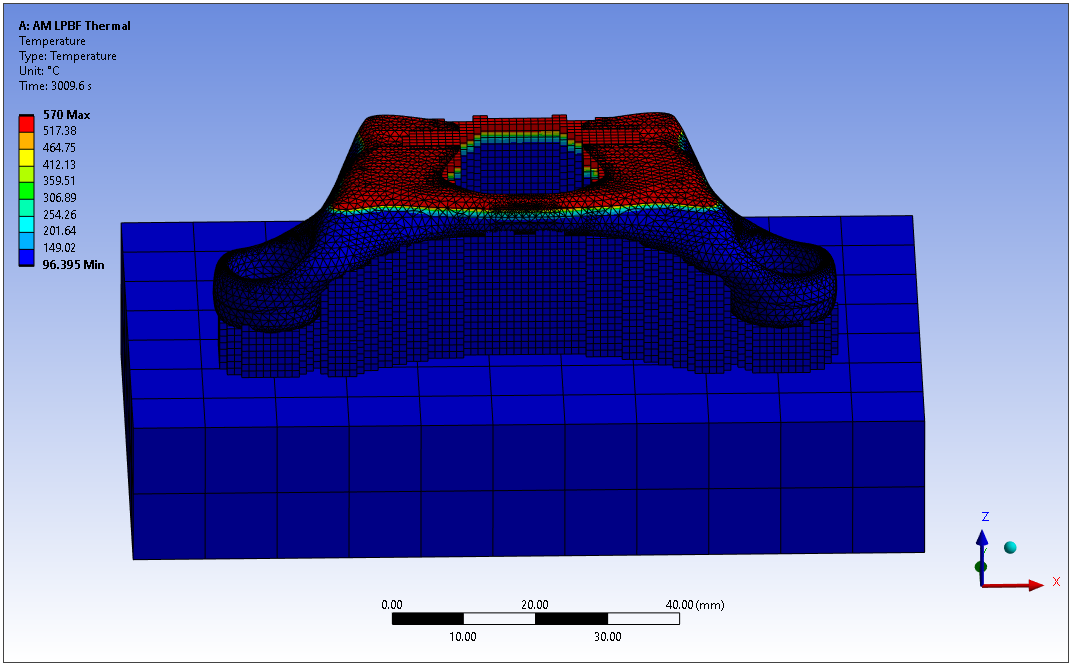
Here is the result at time = 3009.6 seconds, just as a new layer is deposited. You can see the highest temperature is 570°C, which is the melting temperature for AlSi10Mg. The layers below the new layer had already cooled rapidly.
Use the animation controls at the top of the Graph window. Click the Result Sets button
 and the Update Contour Range at Each Animation Frame
button
and the Update Contour Range at Each Animation Frame
button  .
Adjust the number of seconds for the animation, then click Play. See Animation in the Mechanical User's Guide for
more information about animation controls.
.
Adjust the number of seconds for the animation, then click Play. See Animation in the Mechanical User's Guide for
more information about animation controls.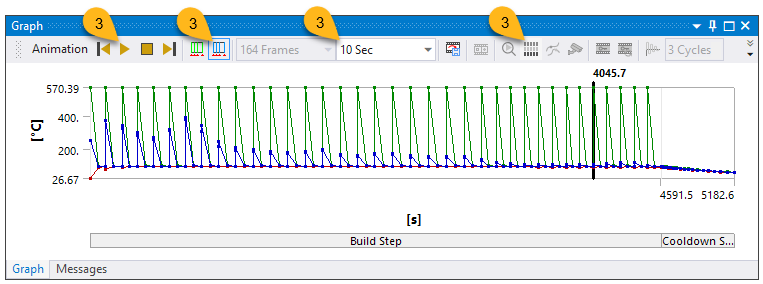
 The image above is an animated gif. The animation is not viewable in PDF format.
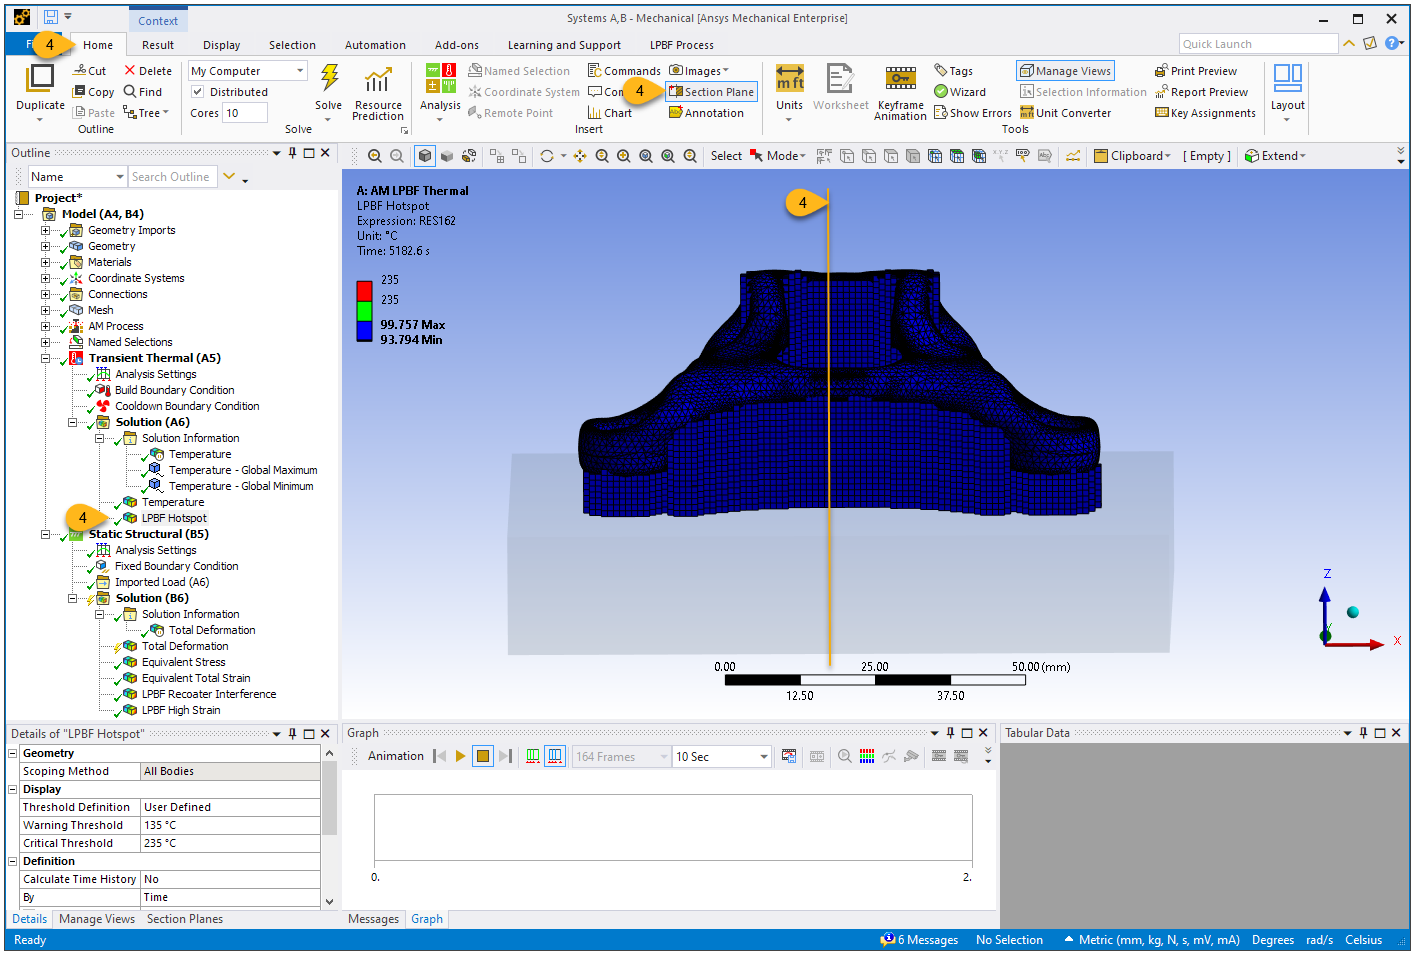
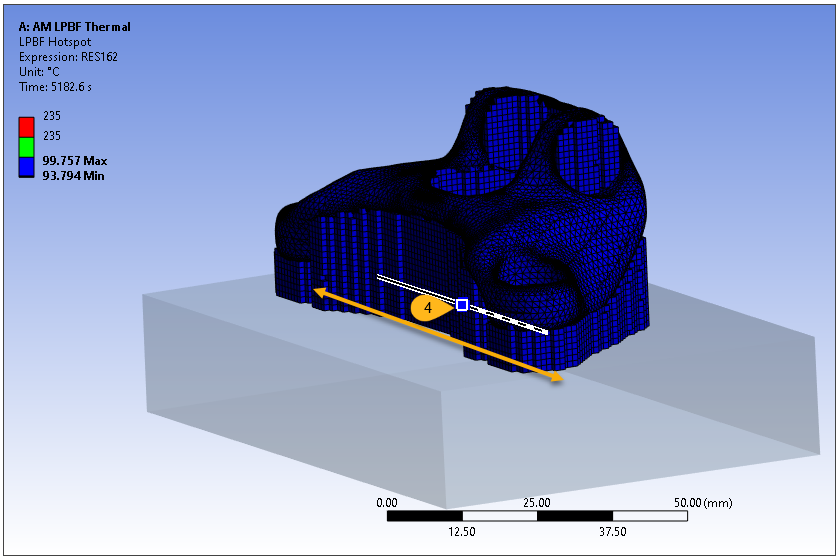
Under Transient Thermal > Solution, click LPBF Hotspot. This result shows the temperature that each layer cools down to before a new layer is added. The worst hotspots are going to be the areas with the highest temperature for that layer. This result can reveal areas of overheating that may be of concern. Overheating can lead to poorly shaped melt pools that can affect material properties and porosity in the part.
For this bracket, the entire part looks blue, meaning there are no hotspots to worry about given the threshold criteria we specified. But hotspot results are localized (based on nodal values), not averaged across the layer. We'll use a section plane to reveal any possible hotspots inside the part.
Click the Home tab, then Section Plane.
Holding the left mouse button, draw a line anywhere through the part to create the section plane. When you release the mouse button, the part appears cut at the plane. Rotate the part so that you can see the interior.
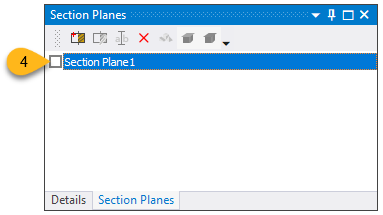
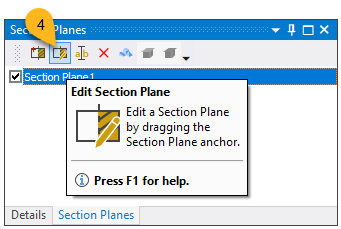
In the Section Planes panel at the bottom left corner of the UI, select the newly created section plane and click Edit Section Plane.
Drag the section plane anchor back and forth to see the inside of the part. Again, based on our hotspot threshold criteria, there are no green or red areas, indicating that there are no hotspots to be concerned about.
Clear the check box in the Section Planes panel to see the entire part again.