A Porosity simulation produces one summary result page (the parent simulation) showing the set of permutations (child simulations) included within it. Selecting any of the permutations brings up a new page showing the individual permutation simulation log and inputs. There are no files available for export for the permutation simulations. All the relevant data are provided in the Porosity Summary file in the parent simulation. This is a .csv file with columns of data as shown in the case study below.
Lack-of-fusion porosity is identified as values of solid ratio below 1. In other words, an ideal solid would have a solid ratio of 1. Anything that is not solid is a void, or powder. The goal when additively manufacturing parts is to choose process parameters that optimize our process. One guideline is to choose the fastest scan speed and the widest hatch spacing possible while staying within our target processing region so as to avoid porosity. Depending upon what our acceptable level of porosity may be, we can reduce our choices to a few viable candidates.
![]()
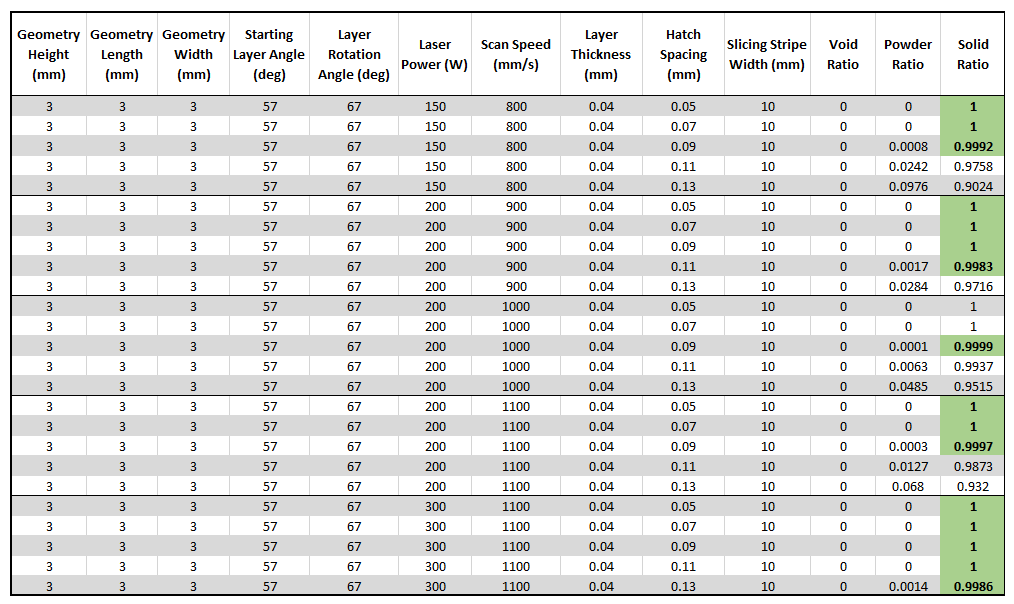
The following table shows porosity results for 25 of the 40 permutations. We have identified the best candidates based on a target criteria of less than 0.5% porosity (shaded in green). The fastest build rate of these candidates is the combination of 300 W power, 1100 mm/s scan speed, and 0.13 mm hatch spacing.