


A call stack displays the sequence of executed function calls that have lead up to the currently paused statement. It is populated from the currently executing function, which is the most nested, to the top level, which is the shallowest function. For example, assume that a script has four functions and that a breakpoint is set at line 15:
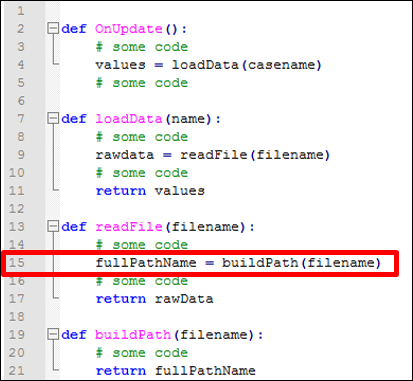
When the function OnUpdate() is executed, it calls the
function LoadData(), which calls the function
readFile(), which calls the function
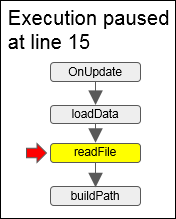
buildPath(). At the breakpoint set on line15, the
debugger pauses while the function readFile() is
executing.
At this point, the Call Stack tab displays these entries:
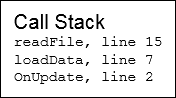
If you click an entry in the call stack, the debugger takes you to the corresponding script and line.