


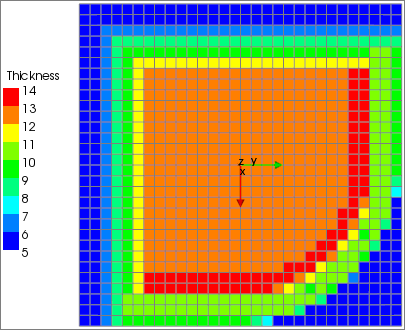
The Thickness Plot shows the thickness distribution for an entire lay-up or single plies. The Angle Plot is purely a ply-wise plot and shows the orientation angle of a selected ply. The Look-Up Table Plot enables you to explore the interpolation result of scalar columns. Scalar columns can be used to define thickness, angle, or degradation fields.
Components
The component of the plot include:
Thickness: show the element thickness or ply-wise thickness
Relative Thickness Correction: show the thickness scaling due to draping or lay-up mapping