2.1.17.1. Interface Options

The right-click context menu for the Lay-Up Plots object provides the following options:

  • Create Thickness: plot thicknesses per element or ply-wise

  • Create Lay-Up Angle: plot ply-wise angles (fiber, shear angle etc.)

  • Create Draping Mesh and Flatwrap: plot draping mesh and flatwrap

  • Create Scalar Look-up Table: plot scalar look-up tables and interpolations

  • Create Field Definition: plot field definition data

  • Create Lay-Up Mapping: plot lay-up mapping data

  • Create User-Defined: plot a custom set of data on the mesh

  • Paste: paste a lay-up plot from the clipboard.

The context menu for each individual Lay-Up Plot option includes the following selections:

  • Properties: Display the Plot Properties dialog.

  • Update: Update the selected plot.

  • Copy: Copy the selected plot definition to the clipboard.

  • Paste: Paste a lay-up plot from the clipboard.

  • Delete: Delete the selected plot.

  • Hide: Hide the selected plot.

  • Show: Show the selected plot.

All plots can display the information for all or a selection of elements through the data scope. A thickness and angle plot for all Element Sets is predefined by default. The plot definition for lay-up plots follows the same definition as solution plots.

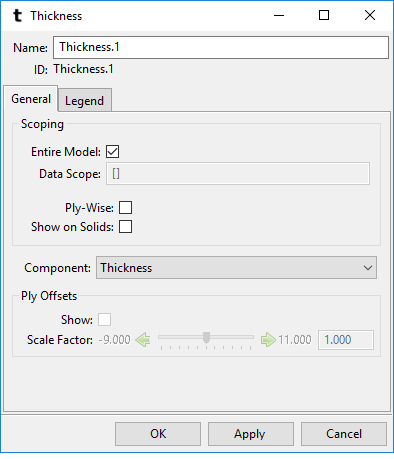
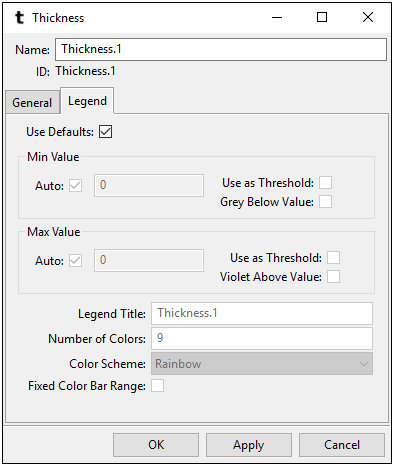
The properties for plots, such as Thickness properties illustrated below, have two tabs: General and Legend. You can use the General tab to configure the plot's basic settings. Once you deselect the Use Default check box, the Legend tab enables you to specify minimum and maximum values as well as changing the legend title, range, and color display.

General TabLegend Tab

The following general settings can be found in most of the plots:

  • Name: Name of the plot.

  • Entire Model: If enabled, the scope of the plot is the entire shell- or all the solid elements of the model if Show on Solids is active. Otherwise you can define the scope through the Data Scope property. By default, Entire Model is enabled.

  • Data Scope: Determines what scope is used in the plot. Element sets, OSS, Modeling Plies & Sampling Points can be selected in the data scope. The data scope of a sampling point covers all plies that are intersected by the sampling point.

  • Ply-Wise: Activates a ply-wise plot display. Thickness and angle plot are only shown if a ply is selected. Angle plots are automatically set to ply-wise. The plies can be selected from the Modeling Groups, sampling points or solid model analysis plies.

  • Show on Solids: Shows plot data on solid elements and for solid elements only.

  • Component: Allows you to select different components

  • Ply Offsets: Visualize the results of a ply-wise plot on the selected plies at their true or scaled offset from the reference surface (Angle Plot only).

Property descriptions include:

  • Use Defaults: Uncheck this option to manually configure the color bar. Otherwise, the default settings are used.

  • Min Value: Defines the value of the first label. Disable Auto to set a user-defined value.

  • Max Value: Defines the value of the last label. Disable Auto to specify a user-defined value.

  • Use as Threshold: If enabled, the min and max labels become the second and second-to-last labels in the color bar, respectively.

  • Grey Below Value: Grey is inserted in the color bar. All values below the min label are then shown in grey. If Use as Threshold is on also, then the min label becomes the third label, and the second and first are evaluated accordingly.

  • Violet Above Value: Violet is appended to the color bar. All values above the max label are then shown in violet. If Use as Threshold is checked as well, then the max label becomes the third-last label, and the second-last and last are evaluated accordingly.

  • Legend Title: Specifies the title that is shown above the color bar. By default, the name of the plot is used.

  • Number of Colors: Sets the number of colors for the color bar.

  • Color Scheme: Chooses one of the preconfigured color schemes.

  • Fixed Color Bar Range: Activates the Fixed Color Bar Range option to prevent the color bar from changing when you switch from one ply to another. If enabled, the overall min and maximum values of the scope are set as color bar min and max labels. If ply-wise is enabled as well, the global min and max are used.


Note:  Only a subset of the plots support Imported Plies. Currently, these are Thickness Plot, Angle Plot and Lay-up Mapping Plot. To plot data on Imported Plies, the Entire Model and Ply-Wise options must be enabled.


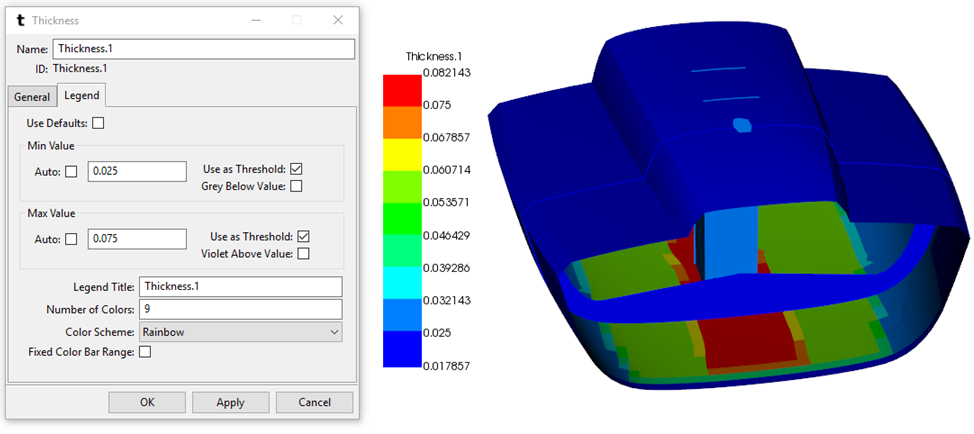
Thickness plot with "Use as Threshold" on for both the Min and Max Value.

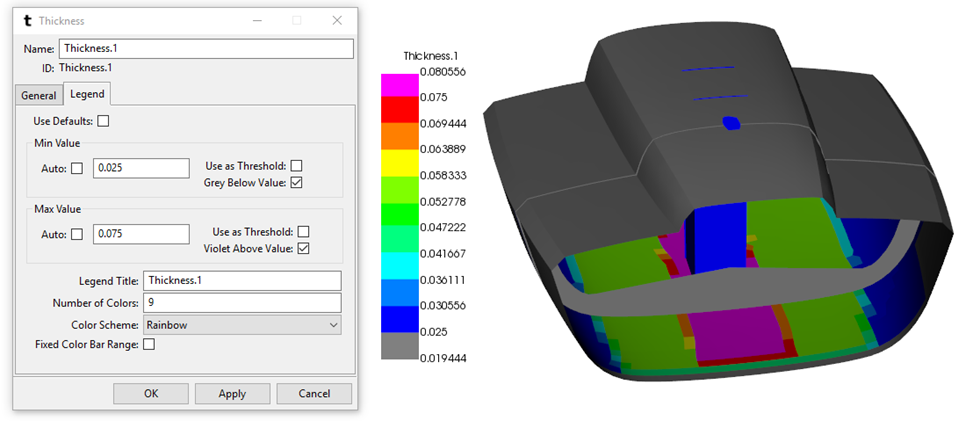
Thickness plot with "Grey Below Value" and "Violet Above Value" on.