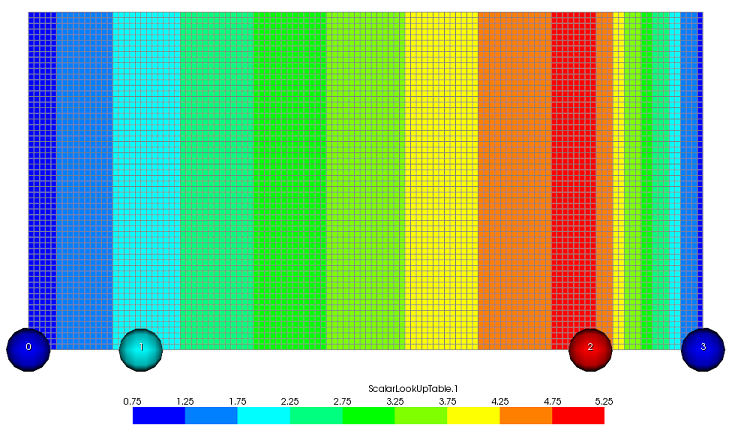
The Look-Up Table Plot enables you to explore the interpolation result of scalar columns. Scalar columns can be used to define thickness, angle, or degradation fields for instance.
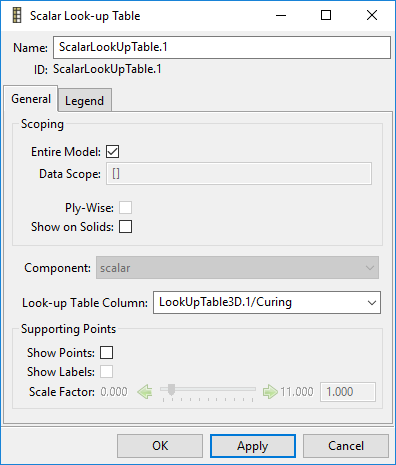
For this plot type, specific options of the General tab include:
Look-up Table Column: Select the Look-up Table column data that is to be plotted.
Supporting Points:
Show Points: Visualize the location of the supporting points of the plotted look-up table data.
Show Labels: Show labels indicating the row index in the respective look-up table.
Scale Factor: Scale the size of the supporting points.
Show Labels: Show labels indicating the row index in the respective look-up table.
Scale Factor: The supporting points can be scaled in size.