You can generate stress-strain charts for Constant or Variable material evaluations. To do so, right-click Constant Material Evaluation or Variable Material Evaluation in the outline window and select Add Stress-Strain Chart.
This adds a node in the outline and shows the following options:
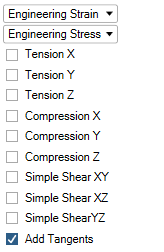
Strain: Choose whether to plot the Engineering Strain or the True Strain.
Stress: Choose whether to plot the Engineering Stress or the True Stress.
Load Cases: Choose for which load cases the stress-strain curves are shown.
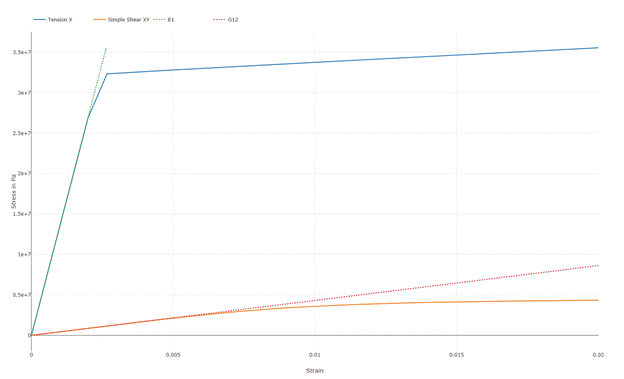
Add Tangents (only available for constant material): Choose to add tangents that would correspond to a linear elastic material behavior (based on the computed engineering constants); see the dotted lines in Figure 1.1: Example of Stress-Strain Curves.
This allows you to verify that the computed material properties are consistent with the computed stress-strain curves and allows you to see deviation from linear elastic material behavior more easily.
Note: For large strain the tangents do not necessarily represent the linear elastic material behavior. If large deformations are active, then the tangents in the true strain-true stress diagram correspond to the linear material behavior. Similarly, if large deformations are off, then the tangents in the engineering strain-engineering stress diagram correspond to the linear material behavior.
Click Complete to open a new window tab with the chart.