


Tone-to-Noise Ratio
The Tone-to-Noise Ratio (TNR) computation is detailed in both ECMA-418-1 (former ECMA 74 Annex D) and ISO7779:1999 standards. It is applicable for tones whose frequencies stand between 89.1 and 11 220 Hz.
Sound: Analysis and Specification provides an automatic tone detection procedure from the signal’s spectrum (with a resolution around one Hz), which is not part of the standards that only define the calculation of TNR at a given frequency. The procedure is therefore used prior to the computation of the Tone-to-Noise Ratio per se.
In Sound: Analysis and Specification, Tone-to-Noise Ratio (TNR) is included in Tonality. You may also calculate the TNR of an order and display it as a curve of TNR versus RPM or time.
For a given frequency ft, the Tone-to-Noise Ratio is computed as the ratio between:
the energy of the peak (Xt), and
the noise energy within the critical band centered at ft (Xn on the picture below, which is the spectrum energy between f1 and f2 without the peak's contribution).
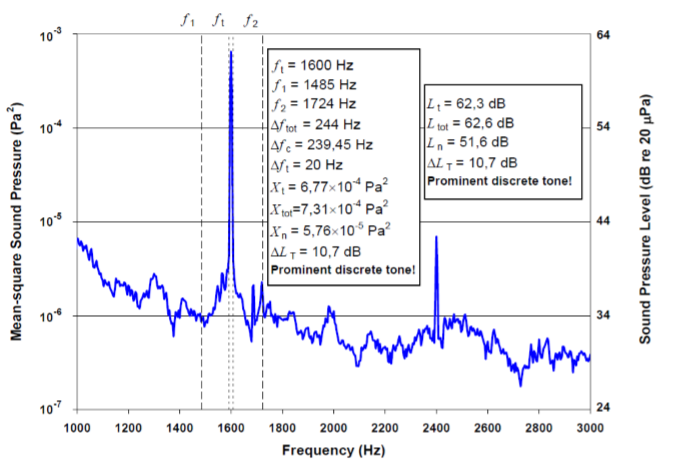
The Tone-to-Noise Ratio is computed using the following formula:
10lg(Xt / Xn) dB
According to this criterion, a tone is considered as prominent if:
Tone-to-Noise Ratio > 8 dB for ft > 1000 Hz
Tone-to-Noise Ratio > 9 + 8.33 log (1000 / ft) dB for ft< = 1000 Hz
The computation is slightly more complex if there are several peaks in the same critical band. Depending on the frequency distance between these peaks, either their energies are summed up, or only the maximum peak is considered. In either case, the critical band’s noise energy is calculated without the peaks’ energies.
Two outputs/results are available for the Tone-to-Noise Ratio computation:
The Tone-to-Noise Ratio (dB) curve over the frequency scale. The Tone-to-Noise Ratio value is displayed for each detected tone. The threshold for considering that a given tone is prominent (as defined above) is also displayed as a blue curve.
The detailed Tone-to-Noise Ratio results, in an information window displaying the following data:
Signal name
Sampling frequency
Time limits of the analysis
Maximal Tone-to-Noise Ratio on the signal
Calculation details for each detected tone (tone frequency, prominence ratio, tone level, tone bandwidth, and ratio between the tone bandwidth and the critical bandwidth). The standard recommends to restart the computation with a larger FFT size if the tone bandwidth ratio is greater than 0.15.