Curve and Legend Display Options
This procedure shows how to set the curve display-type and color and options for displaying the legend in a Time-domain or Spectrum window.
To Edit the Curve/Legend Properties
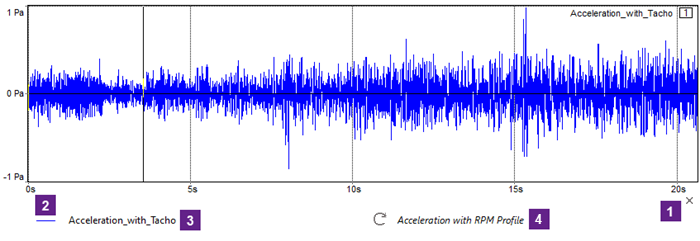
It is possible to display a legend for all 2D curves, attached to each display block. For each line you can change the color, change the name displayed, and add a comment in order to provide a good summary of the content of the block.
-
Click the
 or
or
 icon
icon  at the bottom-right corner of
the display block to Hide or Show
the entire legend. Note that the icon will be hidden until you hover over this
location.
at the bottom-right corner of
the display block to Hide or Show
the entire legend. Note that the icon will be hidden until you hover over this
location.
-
Click the curve style icon
 to open the curve options menu:
Hide/Show curve to hide or show this curve in the display
Change curve color to open the Color dialog and choose a different color for this curve
Change curve style to open the Curve properties dialog and choose different line styles or colors for any of the curves in this time-domain window
-
Double-click the Legend field
 to edit the legend text. The
ESC key will cancel your changes.
Note: Changes made here will only affect the legend displayed below the curve in the time-domain or spectrum window. This does not change the Title of the signal as defined in the left-hand Information panel (see 2D Curve Management).
to edit the legend text. The
ESC key will cancel your changes.
Note: Changes made here will only affect the legend displayed below the curve in the time-domain or spectrum window. This does not change the Title of the signal as defined in the left-hand Information panel (see 2D Curve Management). -
You can click the
 icon to the right of the Legend field to reset the
legend text.
icon to the right of the Legend field to reset the
legend text.
-
Double-click the legend comment field
 to edit the legend comment.
You have updated the curve and legend options for the time-domain or spectrum window.