


Managing the Display
- If you want to move the map, left-click and move the mouse at the same time.
-
If you want to use the zoom, rotate the wheel, click Edit, Activate Zoom or click
 and then left-click or right-click.
Click
 to display the original size.
When moving the mouse over the map, values at the position are displayed in the status bar.
- If you want to view spectrum curve at the mouse position, click
 .
. -
Status bar provides Angle, Depth, Luminance or Relative brightness, Vision Mode, Filter values.
Angle is the angle between fixation point and the map field pointed by mouse.
Depth is the distance between the observer and the 3D scenery's point pointed by mouse.
Vision Mode can be Photopic, Mesopic or Scotopic. It is estimated to starting from the values of the displayed luminance map.
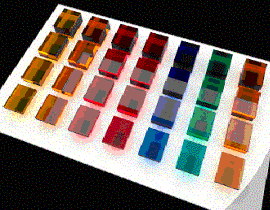
Images below show the results when one changes the level of luminance of a simulation of a set of colored translucent plastics.
 |
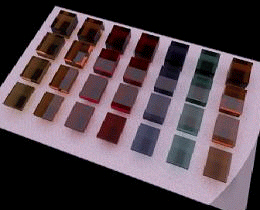 |
| With Virtual Photometric Lab Maximum luminance of the map: 0.7 cd/m² | With Virtual Human Vision Lab, mesopic vision Maximum luminance of the map: 0.7 cd/m² |
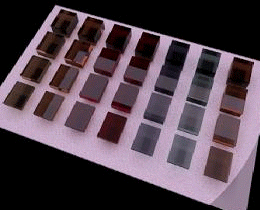
Following images were obtained with Photometric Calc by multiplying luminance value of the initial map.
For scotopic vision, there is a poor colors perception because cone sensitivity is insignificant. Cones are responsible of color perception.
In case of mesopic vision, as the map luminance increases, one starts to perceive some colors: first red color, then orange, green and last blue.
 |
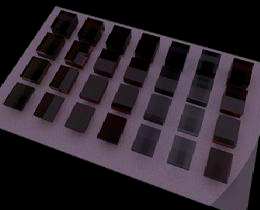 |
| With Virtual Human Vision Lab, mesopic vision Maximum luminance of the map: 0.35 cd/m² | With Virtual Human Vision Lab, scotopic vision Maximum luminance of the map: 0.005 cd/m² |
-
If you want to modify the number format, right-click the status bar.
The number format is the number of decimal per value.
-
If you want to switch between luminance unit and relative brightness, click View, Relative brightness.
Brightness is a subjective attribute of light to which humans assign a label between dim and bright. Brightness is perceived but not measured. The sensitivity of the eye to luminance is non-linear and complex that's why brightness notion is used.
The most brilliant point of the map has a relative brightness of 100.
- If you want to modify the axis unit of displayed values, right-click the status bar.
-
If you want to display grids and other options, right-click the map to select tools. As an example you can show ruler, set ruler parameters, show axis on cross, snap cross to grid, show tooltip, show gray around the map, fill shape, show primary or secondary graduations, set graduations parameters, show primary or secondary grids, set grid parameters.
Note: When opening a *.lpf, in the XMP the first measure area from the Measures tool is displayed on the first opening. The selected measure area (in the Measure tool) upon save is displayed on the next openings. If you activate Show tooltip, two tooltips will be displayed:- One tooltip corresponds to the coordinates information and the value (depending on the map's unit) of the pointed pixel on the map.
- One tooltip corresponds to the measure value selected in the Measure tool for the displayed area.
When opening a XMP (out of the Light Expert context), if you activate Show tooltip, the tooltip will display the coordinates information and the luminance of the pointed pixel on the map.