


Illuminance Cone Diagram Overview
The page presents an overview of the Illuminance Cone Diagram in general and in Speos.
Illuminance Cone Diagram Principles
During and at the end of the design process, lighting designers want to check the photometric characteristics of the luminaire. One of them is the Illuminance Cone Diagram.
The Illuminance Cone Diagram describes the evolution of the average illuminance within an area delimited by a defined angle (beam cone diameter) of a luminaire at different distances from the apex of the cone (mounting distance) where the floodlight is located.
Thanks to the Illuminance Cone Diagram, lighting designers can observe both the total light output and the angular spread of the light output then enabling the appropriate floodlight to be chosen to give the required illuminance at the mounting distance of the floodlight.
The Illuminance Cone Diagram is also used to compare and choose between different luminaires for a specific setup or to adapt the setup to a luminaire.
The Illuminance Cone Diagram data are useful to lighting designers because it allows calculations to be made on how many luminaires are needed to achieve the desired illumination in a specific installation.
In Speos Labs
Thanks to the Illuminance Cone Diagram tool, you can:
save time to run Speos simulations to get the different illumination maps and do the analysis.
directly use the data from the diagram to write the product spec sheets.
Example
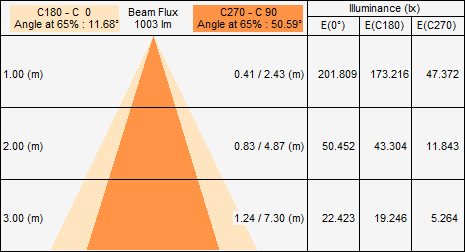
Figure 1. Illuminance Cone Diagram at 65% intensity peak |
Each line represents a mounting distance at which illuminance is calculated according to the intensity peak percentage specified and at specific C-planes.
Light orange represents the light distribution for a section at C180-C0 section.
Dark orange represents the light distribution for a section at C270-C90 cut.
Dark orange and light orange cone show the difference of beam spread in 2 orthogonal sections. The view is normalized on the larger cone. In general the maximum illuminance value is achieved at a beam angle of 0°, represented by the column E(0°).
In this example, for a mounting distance of one meter and a 65% intensity peak, the illuminance calculated on the C180 plane is 173,216 lx.