


Doing Analysis
The human eye has a high range of luminance detection. It is able to detect luminance level from 10-6 cd/m² to 108 cd/m². Displays do not have such a high dynamic.
The Virtual Human Vision Lab includes specific functions able to display the final image as if the scene is seen by a human. The luminance map compression is required.
With Analysis tools, you can have information on the luminance distribution of the map, and on the level of compression.
Click Tools, Analysis... to display the Analysis tools window.
Analysis tools depends on the eye adaptation.
The fovea luminance histogram shows the distribution of luminance for the current XMP file.
For more details about fovea, you can view Areas of Look At.
The fovea luminance is computed into a solid angle of about 1°, so the luminance map is subdivided into solid angle of 1°.
The histogram shows for each luminance value, the number of fovea area of the map having this luminance.
The Display luminance according to scene luminance diagram shows the relationship between the map luminance and the display luminance.
If it is a dynamic adaptation, the diagram depends on the fovea luminance histogram. Here the compression of the luminance map is made to take into account human vision properties, and to allocate the maximum of display dynamic for luminance area with a high number of areas. For luminance value for which histogram contains a lot of values, the curve slope of the diagram is high.
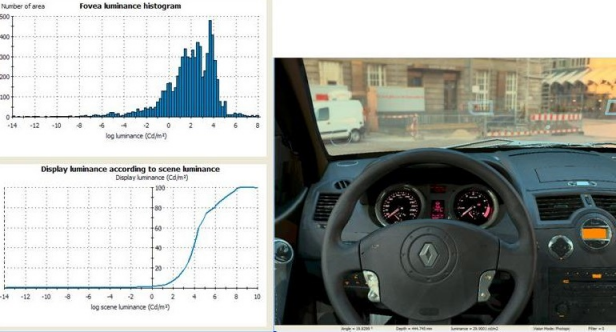
Dynamic adaptation
If it is a local adaptation, the diagram only depends on the adaptation luminance.
For more details about adaptation luminance, you can view Parameters of Vision Parameters.
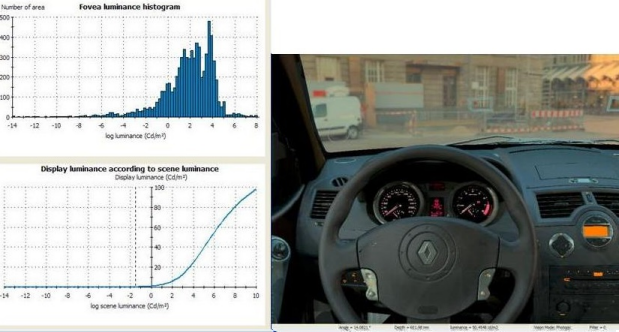
Local adaptation