


Applying a Rule
What is a Rule?
A rule allows you to compare a measure to thresholds (Minimum, Maximum) and/or compare a measure to specifications (Maximum Specification and Minimum Specification).
How to create a Rule?
To create a rule, you need:
- a Rule: Rule corresponds to the rule's name.
- a Minimum and/or a Maximum: these values represent threshold values to be compared to the measure result.
The conventions to write measure variables are Area_name.Magnitude_type.Operator_type.Measure_Type or Area_name.Measure_type. Only Area_name. is mandatory.
The first convention is best suited when working with a lot of measures on one area as it allows you to precise which value you want to consider for the rule. The second convention is best suited when working with a few measures per area as the first measure (Measure type) encountered in the area is used for the rule.
For rules, only the rule's name is necessary.
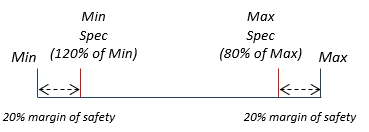
You can also define specification thresholds:
A Minimum Specification and/or a Maximum Specification: these columns represent safety margins. They create an intermediary level of comparison for the measure.
- In the Measures table, select an Area.
- In the Rule column, define the name of the rule.
- In the Minimum column, define a value or formula.
-
In the Maximum column, define a value or formula.
The result appears between square brackets after the formula or value.
Rule examples:
- Rule with a constant value:
- Rule: Rule_1
- Maximum=5700[5700]
- Rule with a variable:
- Rule=Rule_2
- Maximum= Area_1.Maximum [98.5]
- Rule with a formula:
- Rule=Rule_3
- Maximum= abs(Area_1.Maximum*-2) [197]
Understanding a Measure with a Rule
Color Code

The Measure result is compared to the Minimum and/or the Maximum and compared to Minimum Specification/Maximum Specification if defined.
- When the Minimum or Maximum criterion is not met, the rule is not respected. The rule becomes red (failed).
- When the Minimum and Maximum criteria are met, but the Minimum Specification and/or Maximum Specification are not met, the rule becomes orange (specification failed).
- When the Minimum and Maximum criteria are met, and the Minimum Specification and Maximum Specification are met, the rule becomes green (passed).
- If the rule is not considered, the line is gray. There can be several reasons to this:
- the rule is not set,
- the rule includes a syntax error as a missing parenthesis;
- the area is not consistent,
- the measure type is not consistent with the area shape.
_XMP_Measures_Tool_Color_Code_Example.png)
_XMP_Regulation_Specification_Table.png)
Measurement Indicators
The values % of Min, % of Max, % of Min Spec, % of Max Spec correspond to the ratio of the measured value to the Minimum, Maximum, Minimum Specification, Maximum Specification thresholds.
Measurement indicators are dedicated to be used for photometric/radiometric/colorimetric/spectral values. If the measure is different and negative, the measurement indicators are neither displayed in the Measures tool nor in the measures list of a map simulation result in the Simulation tree.
The most critical value (the threshold closest from the measure) is taken into account to calculate the ratio.
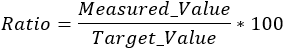
In the Ratio calculation, the Target_Value correspond to the thresholds measurement indicators (% of Min, % of Max, % of Min Spec, % of Max Spec).
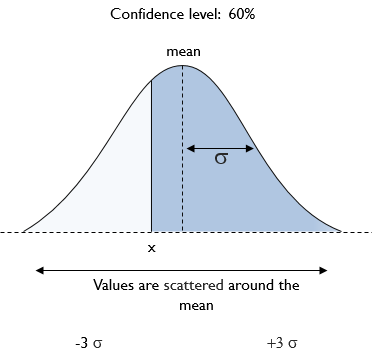
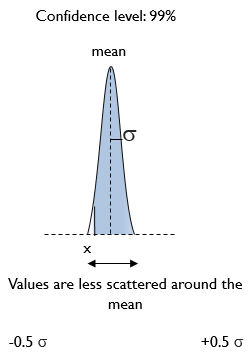
The Confidence Level allows you to evaluate the reliability of its measure according to self-designed criteria.
It represents the probability for the result of the measure to fall into a defined interval and to meet a defined criteria.
Example of criteria illustrated below: estimate of the probability of a measured value (v) to be superior to a target value (x).
The standard deviation (σ) quantifies the dispersion of data around the average and is used to calculate the confidence level.
How to delete a Rule?
To delete a rule, in the Rule column, select the rule to delete and click Remove area or
measure or rule
 .
.
Deleting a rule does not delete the area.