


3D Colorimetric Data
The 3D Colorimetric Data allow you to display a 3D map with:
different display modes: solid, wire, dots or solid+wire,
different color space representations: Lab, XYZ or RGB,
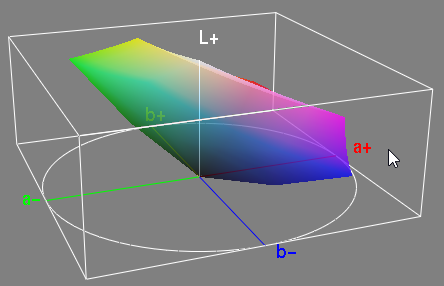
a representation of the Lab axis (L, a+, a-, b+, b-) as in ICC3D (Interactive Color Correction in 3 Dimensions);
an optional display of the Lab circle,
an optional display of the cube representing the total colorimetric space.
When moving the mouse pointer over the XMP map, the corresponding point is displayed in real-time in the 3D diagram.
To change the 3D diagram settings:
Right-click the 3D diagram and select Options.
Modify the 3D colorimetric data options if necessary.
Sphere diameter: defines the diameter of spheres displayed in the 3D diagram.
Gamut transparency: defines the transparency of the 3D screen gamut.
Lab Distance between samples: used to space color samples in the measure area.
Gamut 3D Sharpness: allows you to set the number of vertices on the gamut.
Inside gamut sphere color: defines the color of spheres displayed inside of the screen gamut.
Outside gamut sphere color: defines the color of spheres displayed outside of the screen gamut.
Reference sphere color: defines the color of the sphere representing the Reference color defined in the 2D colorimetric diagram.
For these last three options, either keep the true color (default) or select another one from the color picker.
Click OK to validate.