


Understanding the Parameters of an Intensity Sensor
This page describes advanced settings to set when creating an Intensity Sensor.
Intensity Sensor Format
Various sensor formats are available when defining an intensity sensor.
These formats correspond to light distribution standards and will generate different file formats as an output.
Each standard have its own specificities (axes, orientation, integration plan of light etc.).
- IESNA files (*.ies, structured text file format) correspond to the U.S. standard data format for storing the spatial light output distribution for luminaires. IESNA A, IESNA B and IESNA C correspond to three different specifications of IES.
- Eulumdat files (*.ldt, structured text file format) correspond to the European standard data format for storing the spatial light output distribution for luminaires.
| IES A | _IES_A.png) |
| IES B | _IES_B.png) |
| IES C | _IES_C.png) |
| Eulumdat | 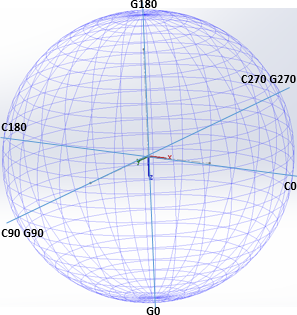 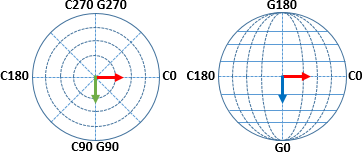 |
Near Field
Description
In practice, actual measurement devices measure intensity at a finite distance. In Speos, the Near Field option allows you to model the integration at the finite distance by defining the actual cell of an intensity bench.
The sensor cell is brought closer to the source, therefore bringing the measuring field of the sensor closer to the source. A near-field sensor is useful when wanting to compare simulated intensity to measured intensity on small devices. This option generates results that are physically closer to reality.
Light Contribution
For each pixel of the Intensity Sensor corresponds a virtual cell located at a Cell distance drom the center of the sensor, with a size of Cell diameter.
All incoming light on the cell contributes to the corresponding intensity level.
_Near_Field_Light_Contribution.png)
Cell Description
In practice, the sensor cell is a disk which size is determined by the Cell diameter value. This diameter corresponds to the size of the photosensitive sensor that would be used to perform the measure in reality.
The Cell distance value defines the sensor visualization in the 3D view.
_Cell_Diameter_Cell_Distance.png)
Make sure to define a Cell Diameter bigger than the pixel size. Otherwise, the sensor angle is smaller than the pixel, and some rays will pass between the pixels and will not be considered. These rays are uselessly calculated, however, the result is still correct.
If the Resolution of X range is different from the Resolution of Y range, take the biggest resolution as reference to calculate your sensor system.
To calculate the adequate system use the following equation: Cell Diameter = tan(res)*Cell Distance*√2
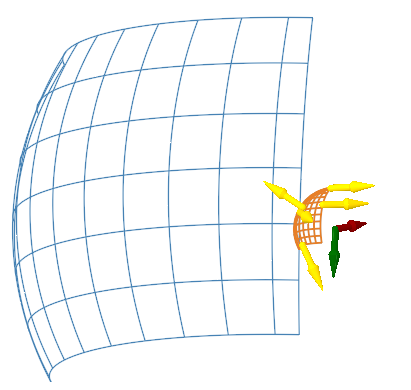
Near Field and Geometries
When defining a near field intensity sensor, geometries located further than the sensor contribute to the result (see example below).
_Sensor_Intensity_Near_Field_Example.png) |
_Sensor_Intensity_Near_Field_Without_Opaque_Body.png)
Result without Opaque Body |
_Sensor_Intensity_Near_Field_With_Opaque_Body.png) Result with Opaque Body |
Near Field Limitations
You cannot use the result of near-field sensor to model the near field of a light source.
The result obtained with a near field sensor can be inaccurate on the edge of the map, over a width equal to the radius of a cell.
Adaptive Sampling
Adaptive sampling allows you to browse a .txt file describing the angles of result to be used for the sensor.
The format of the adaptive sampling file is the following:
For IESNA A and B |
For IESNA C and Eulumdat |
|
|
Intensity Result Viewing Direction
The intensity result viewing direction defines the viewing direction of the observer.
| From source looking at sensor: The viewing direction of the observer is the same as the light direction emitted. | 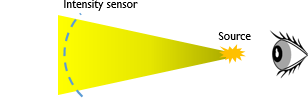 |
| From sensor looking at source: The viewing direction of the observer is in the opposite of the light direction. | 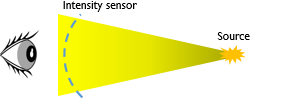 |