


Ray Aberration (rays and spots)
Shows ray aberrations as a function of pupil coordinate.

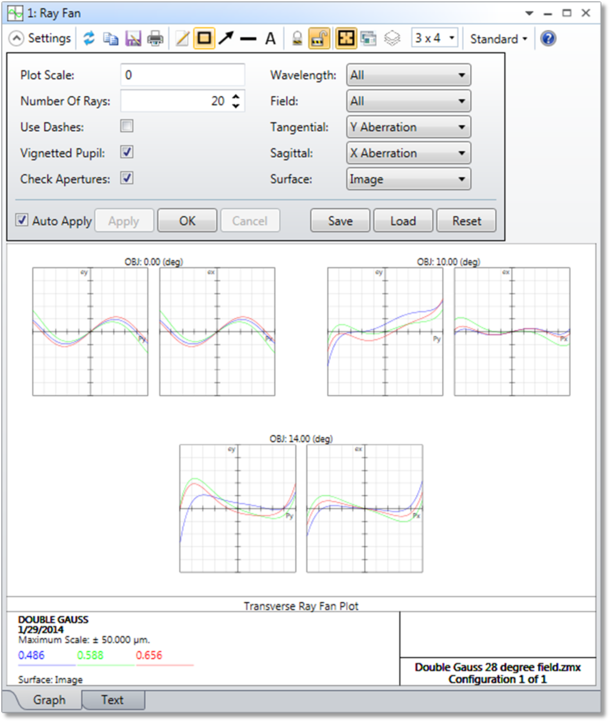
Plot Scale Sets the maximum vertical scale for the plots. The maximum scale is in micrometers for ray fans, waves for OPD plots, or percent for entrance pupil aberration plots. This overrides the automatic selection of scale for the plots. Enter zero for automatic scaling.
Number of Rays This is the number of rays traced on each side of the origin of the plot.
Wavelength The wavelength number for which the calculation should be performed.
Field The field number for which the calculation should be performed.
Tangential Selects which aberration component to plot for the tangential fan. Since tangential fans are functions of the y pupil coordinate, the default is to plot the y component of the aberration.
Sagittal Selects which aberration component to plot for the sagittal fan. Since sagittal fans are functions of the x pupil coordinate, the default is to plot the x component of the aberration.
Use Dashes Selects either solid lines or dashed lines to differentiate the various curves.
Check Apertures Specifies whether or not to check if rays pass all surface apertures. If this is selected, rays which do not pass surface apertures will not be drawn. If not selected, an additional horizontal line is drawn on the Z axis to show that apertures have not been checked and rays pass through the entire area.
Vignetted Pupil If checked, the pupil axis will be scaled to the unvignetted pupil, in which case the data will reflect the vignetting in the system. If unchecked, the pupil axis will be scaled to fit the vignetted pupil.
Surface Selects the surface at which the fan is to be evaluated. This is useful for evaluating intermediate images. See "Evaluating results at intermediate surfaces" below.
Discussion
The tangential fans show either the x or the y component of the transverse ray aberration as a function of the y pupil coordinate of the ray. The default option is to plot the y component of the aberration. However, since transverse ray aberrations are vectors, this is an incomplete description of the aberration. When OpticStudio plots the y component, the plot is labeled EY, when plotting the x component of the aberration, the plot is labeled EX.
The vertical axis scale is given at the bottom of the graph. The data being plotted is the difference between the ray intercept coordinate and the chief ray intercept coordinate. The tangential fan is the plot of the difference between the ray x or y coordinate and the chief ray x or y coordinate at the primary wavelength, as a function of the y pupil coordinate. The sagittal plot is the difference between the ray x or y coordinate and the chief ray x or y coordinate as a function of the x pupil coordinate. The horizontal scale for each graph is the normalized entrance pupil coordinate, either PX or PY.
If "All" wavelengths are shown, then the plot is referenced to the primary wavelength chief ray. If monochromatic, then the chief ray for the selected wavelength is used as a reference. For this reason, the data for non- primary wavelengths will in general change when switching between monochromatic and polychromatic displays.
Because ray aberrations are vectors, with both an x and a y component, the ray aberration fan is an incomplete description of the aberrations, especially when the image surface is rotated or the system is otherwise non- rotationally symmetric. Also, the fans only indicate aberrations along two "slices" through the pupil, rather than over the entire entrance pupil. The primary purpose of the ray fan plot is to determine what aberrations are present in the system; it is not a complete description of the system performance, especially for systems without rotational symmetry.
Evaluating results at intermediate surfaces
OpticStudio can compute analysis results for surfaces other than the image surface by applying assumptions. These assumptions work in most cases, however, there may be cases where the methods described here for analyzing intermediate surfaces are not appropriate, including systems which require ray aiming. All of the changes made to the lens described are made on a copy of the original lens data made for analysis purposes so no changes are made to the original lens data.
If the field type is either real or paraxial image height, the field type is changed to angle or object height for infinite or finite conjugate systems, respectively. The angles and heights used correspond to the primary wavelength chief ray angles and heights as computed for the unaltered system.
If the selected surface precedes the stop surface, OpticStudio moves the stop surface to a (possibly virtual) dummy space prior to the existing surface 1. Unless the system aperture is object space numerical aperture or cone angle, the system aperture is changed to entrance pupil diameter, and the aperture value is set equal to the original paraxial entrance pupil diameter computed for the original stop position. Note this assumption might not be valid for systems that require ray aiming. If the selected surface follows the stop surface, no changes are made to the system aperture or stop definitions.
Surfaces which follow the selected surface are then deleted. The glass of the new image surface is set to be the same as the selected surface.
Most analysis features that compute results for focal mode systems make more sense if the rays are allowed to come to a focus after refraction from the desired surface. For example, the OPD plot is generally a useful diagnostic only when the OPD is measured at the (possibly virtual) focus of that surface. Other features which require a temporary image to be formed include PSF, MTF, and diffraction encircled energy. For these features requiring a temporary image, the new image surface is set to be a standard plane surface. A paraxial marginal ray height solve is placed on the selected surface thickness to place the image surface at paraxial focus for the selected surface. The analysis computation then proceeds at this newly created intermediate image surface. Note the analysis occurs at the paraxial focus formed by the rays after refracting through the selected surface. This shift to paraxial focus is not performed if the intermediate system is in afocal mode.
For more information on afocal mode see "Afocal Image Space" in the Aperture section of the System Explorer.
Some analysis features make more sense if the data is evaluated directly on the surface itself, without allowing the rays to focus to an image. These features include the various spot diagrams, footprint analysis, geometric encircled energy, line/edge spread function, and extended source encircled energy.
Next: