


Wavefront Map

Displays the wavefront error across the pupil
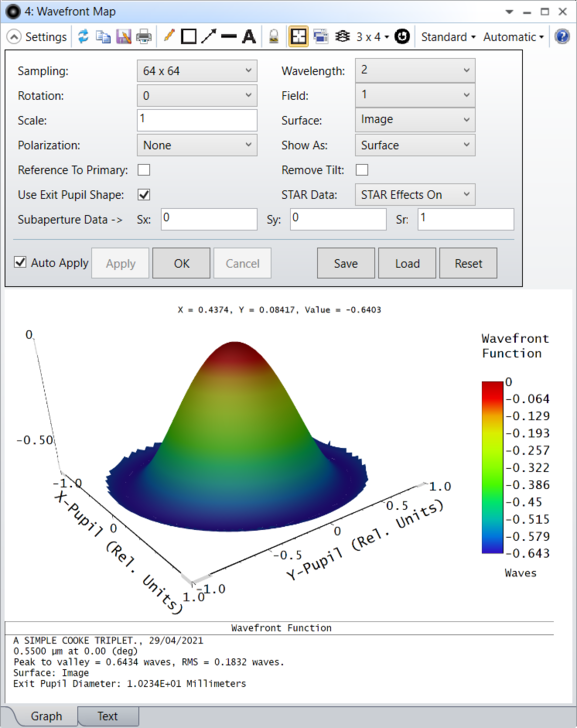
Sampling The size of the ray grid used to sample the pupil. The sampling may be 32x32, 64x64, etc. Although higher sampling yields more accurate data, calculation times increase.
Rotation Rotation specifies how the surface plots are rotated for viewing; either 0, 90, 180, or 270 degrees.
Scale The scale factor is used to override the automatic vertical scaling set by the program on the surface plots. The scale factor can be greater than unity to vertically stretch the plot, or less than unity to compress it.
Polarization If none is selected, polarization is ignored. If Ex, Ey, or Ez is selected, then the phase due to polarization effects for the specified component of the electric field is added to the optical path difference. If the polarization phase exceeds one wave, the wavefront map may display abrupt changes of 2π because no phase "unwrapping" is performed.
Wavelength The wavelength number to be used in the calculation.
Field The field number for which the calculation should be performed.
Reference To Primary By default, the wavefront aberration is referenced to the reference sphere for the wavelength being used. If this box is checked, then the primary wavelength reference sphere will be used instead. In other words, checking this box will cause the data to exhibit the effects of lateral color.
Use Exit Pupil Shape If checked, the shape of the pupil is distorted to show the approximate shape of the exit pupil as seen from the image point for the specified field. The shape is based upon the F/# of the beam in the X and Y pupil directions. If this box is unchecked, then instead the plot will be scaled to circular entrance pupil coordinates, no matter how distorted the exit pupil may actually be.
STAR Data STAR Effects On shows the Wavefront Map with STAR effects enabled. Difference displays the Wavefront Map with STAR effects enabled and the original Wavefront Error subtracted.
Show As Choose surface plot, contour map, grey scale, or false color map as the display option.
Surface Selects the surface at which the data is to be evaluated. This is useful for evaluating intermediate images. See "Evaluating results at intermediate surfaces".
Remove Tilt If checked, the linear X- and Y- tilt is removed from the data. This is equivalent to referencing the OPD data to the centroid.
Contour Format The contour format string. For a discussion of the contour format string syntax, see "The Contour Format String".
Subaperture Data: Sx, Sy, Sr Defines a subaperture of the pupil to compute the wavefront data for. See "Subaperture computations" section in Zernike Fringe Coefficients for details.
Discussion See also the Interferogram feature. For details on RMS wavefront error see "Comments about RMS wavefront computations" section in RMS vs. Field.
Next: