


System Viewer

The System Viewer displays a system-wide view of the Surface Deformations and changes in optical properties due to the fitted multiphysics data. This data is overlaid on the entire optical system in a single window. The information that is displayed can be changed with the Draw Mode setting. Not all controls are available for all draw modes.
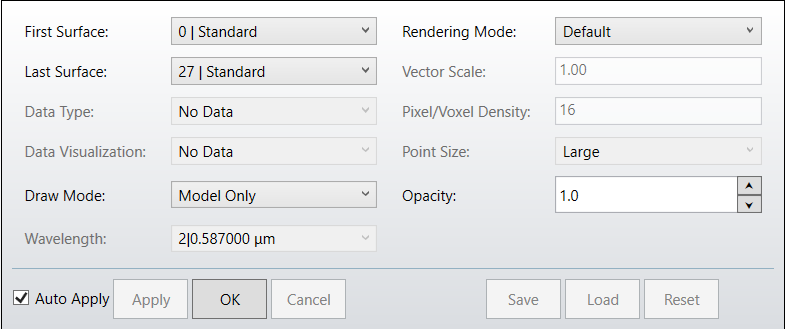
First Surface Select the first surface to view.
Last Surface Select the last surface to view.
Data Type Choose the type of data to be displayed over the optical system. This changes the available draw modes and Data visualization:
Deformations
Temperature
Change in Index
Index
- If Data Type is Deformation, the data is visualized as Deformations Magnitude.
- If Data Type is Direct Index, the refractive index is directly displayed.
- If Data Type is Temperature, the user may select between Index or Change in Index (with respect to the optical element with no fitted data).
Draw Mode Choose the information that is displayed over the optical system. The available options depend on the chosen Data Type. The following information can be displayed:
Model Only: The model with no information displayed.
Deformation Map & Vectors: Both the Deformation Map and Deformation Vectors are displayed on the optical system.
Deformation Map: Deformation magnitude calculated from the deformation vectors and displayed on the optical system. Magnitude, R, is calculated from the X, Y, and Z deformation vectors:
 .
.Deformation Vectors: Vectors displayed on the optical system showing the magnitude and direction of Deformations.
Index Voxels: Refractive index or change in refractive index due to Volumetric data from the FEA/CFD dataset. Data is displayed as 3D voxels around the optical volumes.
Index Point Cloud: Refractive index or change in refractive index due to Volumetric data from the FEA/CFD dataset. Data is displayed as a uniformly sampled point cloud around the optical volumes.
Index Planes: Refractive index or change in refractive index due to Volumetric data from the FEA/CFD dataset. Data is displayed as three cross-sectional planes through the optical volumes.
Rendering Mode Choose the rendering mode of the optical surfaces.
Vector Scale Adjust the display size of the vectors.
Pixel/Voxel Density Used to control the number of cells in a voxel or points in a point cloud.
Point Size Adjust the display size of the fitted data points.
Wavelength Choose at which wavelength to view the index data. The options available are the Wavelengths chosen in the System Explorer.
Opacity Adjust the opacity of the surface or lens.
Next: