


Fit Assessment

Fit Assessment provides controls to adjust the numerical fit settings for each FEA/CFD dataset to its associated surface. The graphics area shows the difference of the FEA/CFD dataset and the numeric fit of the dataset along the surface. This visual representation shows how well the numeric fit is performing and highlights potential trouble areas.
Choose a Surface Number and Data Type to view the fit difference in the graphics window and to access the fit settings. The FEA/CFD data source, root mean square (RMS) fit error, and peak-to-valley (PV) fit error are shown at the bottom of the window for the selected surface.
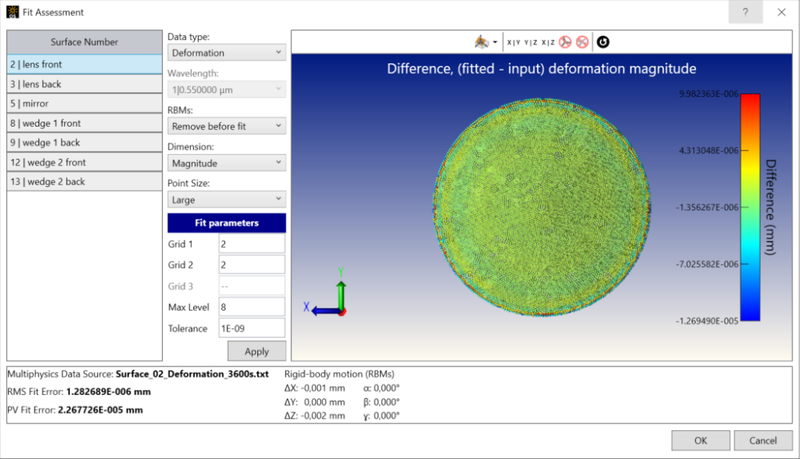
Surface Number Choose the surface to view and edit.
Data Type Choose either the Deformation or Index dataset to view and edit for the selected surface. In this tool, Index data can be the refractive index calculated from the Temperature fitting, or Direct Index, depending on the data type that has been uploaded.
RBMs Choose whether to remove the rigid-body motion (RBM) of the structural data before the fitting process. By default, RBM is calculated and removed before fitting.
Dimension Choose to view the fit difference as a magnitude or along one of the axes. This only changes the graphics area, not the fit settings.
Point Size Change the point size in the graphics area. This only changes the graphics area, not the fit settings.
Fit Settings Adjust the settings used to perform the numerical fit. The following settings are available:
Grid 1/2/3: Used to shape the control lattice of the fitting algorithm. In general, a larger number in Grid 1, 2, and 3 will cause the algorithm to consult more neighboring points during the fit. This will tend toward smoother fits. The Grid 3 parameter is only used for Volumetricdatasets. Values must be between 2 (default) and 100.
-
Max Level: Maximum level of fit refinement.
Tolerance: This parameter is compared to the maximum absolute deviation of the fitted value from the raw FEA/CFD point. If the calculated deviation is smaller than the Tolerance parameter, the fitting algorithm will complete regardless of the number of refinement levels performed. This does not guarantee that the tolerance was achieved during fitting. Use the RMS error and PV error to assess the overall quality.
Note:
- In some cases when the FEA/CFD data is aligned with a user defined transformation, the RMS and PV Fit Error values may differ from the ones obtained in the API. This is caused by a different order of calculations used in the coordinate transformation in the UI.
Apply Apply your settings to the surface and update the graphics area.
Next: