


Field Plot
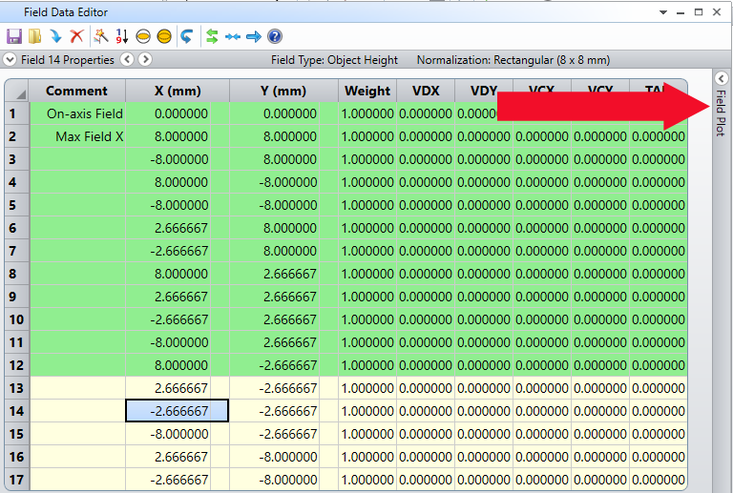
The Field Plot can be accessed at the right side of the Field Data Editor, as shown below. The Field Plot shows a scatter plot of all the defined field points for the current configuration.
Field points whose rows are green in the editor are shown in the Field Plot as green points, and are the points that will be plotted whenever "First 12" is selected in an analysis or layout plot. Field points whose rows are yellow are shown in the Field Plot as yellow points.
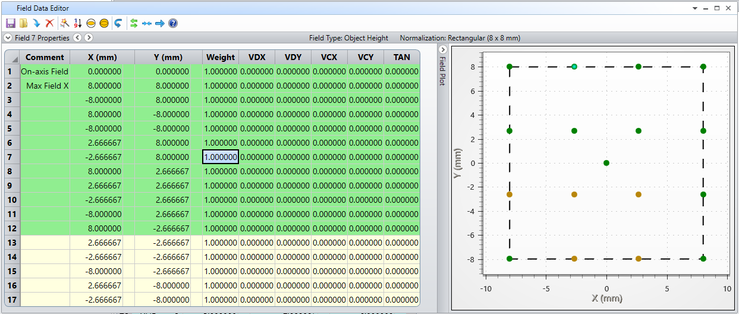
A dashed line shows the outline of the field normalization value on the scatter plot. For rectangular normalizations, the outline will be rectangular. For radial normalizations, the outline will be circular. For radial normalization, all points that fall on the outline will have normalized field coordinates such that Hx2+ Hy2 = 1. For rectangular normalization, points that fall on the left and right sides of the outline will have Hx = 1. Points that fall on the top and bottom of the outline will have Hy = 1.
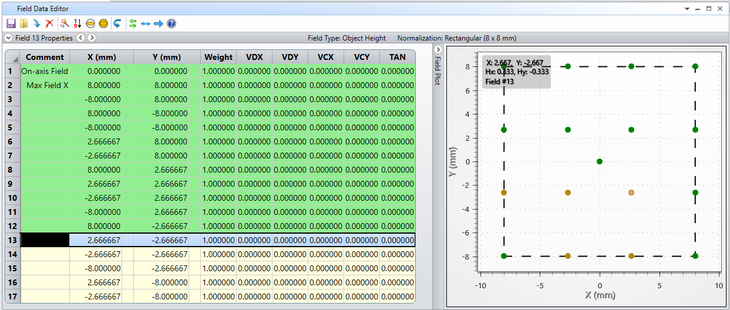
Hovering over a point on the scatter plot will bring up a text box in the upper left of the scatter plot that contains information about that field point. Clicking on any point in the scatter plot will highlight the associated row in the Field Data Editor.
Left-clicking and dragging in the active plot area will select a region of the plot to zoom in on. Right-clicking and dragging in the active plot area will pan or shift the plot. Right clicking on the active chart area will reveal the "Reset Zoom" option.
Next: