Exercise 5: Create a bar chart
Plot materials data on a bar chart using the Chart/Index Stage.
-
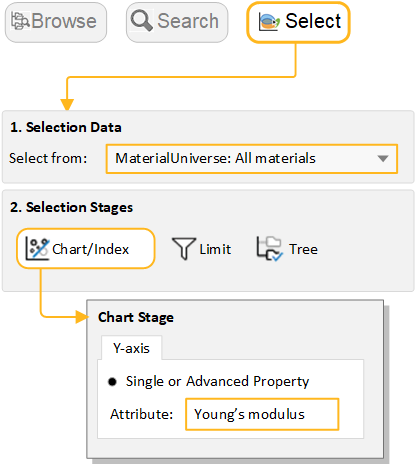
Select MaterialUniverse: All materials on the
Chart/Select tab
-
Click
 Chart/Select, and then
select MaterialUniverse: All materials.
Chart/Select, and then
select MaterialUniverse: All materials.
-
Click
-
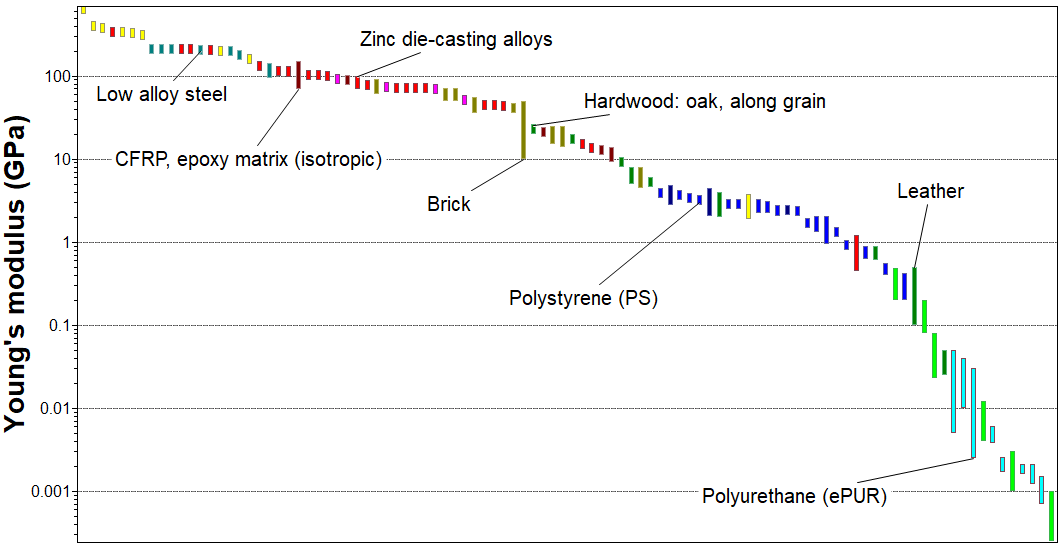
Create a bar chart of Young’s modulus (E)
-
Under Selection Stages, click
 Chart/Index.
- Set the Y-axis attribute to Young's modulus, and click OK.
- For a bar chart, you do not set an X-axis: leave its attribute set to <None>.
-
Under Selection Stages, click
-
Explore the chart
-
Click
 Zoom in
and then drag to zoom in on an area of the chart.
Zoom in
and then drag to zoom in on an area of the chart.
-
Click
 Zoom
out to zoom out.
Zoom
out to zoom out.
-
Click
 Autoscale to zoom back to view the whole chart
again.
Autoscale to zoom back to view the whole chart
again.
-
Click
-
Label records on the chart
- Click a record on the chart and then drag to add and position a new data label.
- To delete a data label, select it and press DELETE. To delete all labels in the chart, press CTRL+A and then press DELETE.