


Plotting a penalty function using a combined property
The penalty function can also be evaluated by plotting it as a combined property on a bar chart.
-
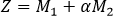
Derive an expression for the penalty function.
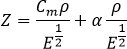
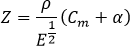
For a stiffness-limited beam in bending, minimizing mass and cost, the penalty function is:
-
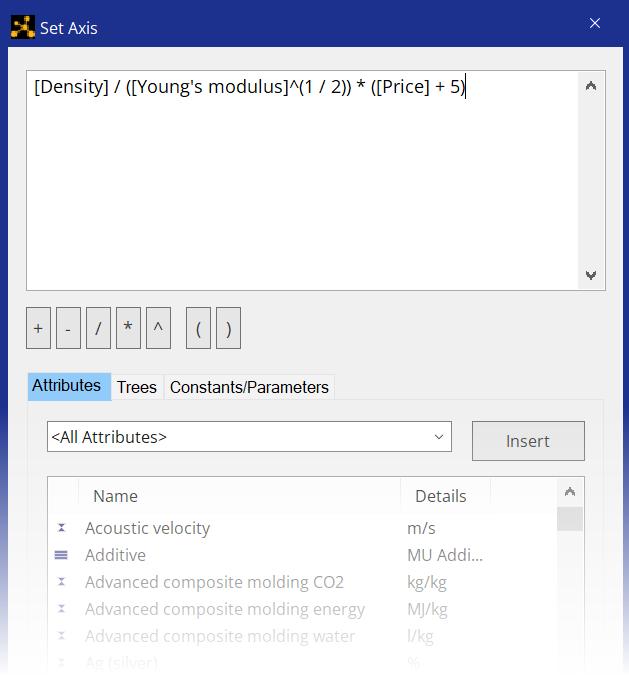
Enter an expression for the penalty function by adding the required attributes
and the value of the exchange constant.
Materials that minimize Z are in the bottom right corner of the chart. The value of Z for each material is affected by the exchange constant value.

This type of chart makes it easier to evaluate and rank the penalty function for each material. However, it doesn't provide information on which objective has been minimized to produce a low Z value.