


Adding a curve
A curve can help to emphasize a trend in the data.
To add a curve annotation to a chart:
-
Click
 Curve on the chart stage toolbar.
The cursor will change to
Curve on the chart stage toolbar.
The cursor will change to .
. - Optional:
With the curve displayed, you can change its shape or appearance, or move the
curve:
Option Description Add a new point to a curve After adding a curve to a chart, you can change the curve shape by adding new points:- Right-click a curve at the position where you want to create a new point.
- Click Add Point.
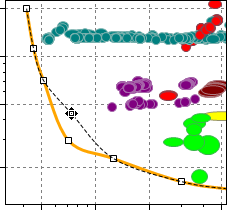
Move current point on a curve Click a curve to select it.
When a curve is selected, the points appear as white squares.
Move the cursor over an existing point on the curve.
The cursor will change to
 when it is
on a point.
when it is
on a point.- Click and drag the point to the new position.
Delete a point from a curve Click a curve to select it.
When a curve is selected, the points appear as white squares.
- Right-click the point you want to delete, and click Delete Point, or hold Ctrl and click a point.
The cursor will change to
 when it is over a point.
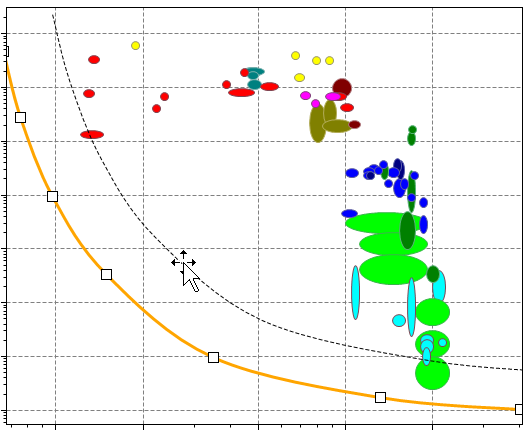
Move a curve Position the cursor over the curve, and click and drag the curve to its new location.
Change curve appearance - Right-click the curve, then click Format line.
- Specify the line style, color, width, start arrow, and end arrow.
- Click Apply to see the result in the chart.
- To use these line format settings for all new curves, click Set as Default.
- Click OK to save your changes and close the Curve Properties dialog.