You can quickly create a data view in Kibana to start viewing your aggregated Granta
MI log data.
Prerequisites: Ensure that:
- Elasticsearch and Kibana are installed and running on your log aggregation
Elasticsearch server as described in the previous topics.
- MI Log File Collector is installed and running on all nodes in the MI cluster.
-
Log in to your log aggregation Elasticsearch server.
-
If Kibana is not already running, start it by running
kibana.bat in an Administrator command window.
Kibana does not currently have an option to run as a Windows service. If you
want to run it as a service so that it starts automatically, you may be able to
do this using a third-party service manager such as
NSSM or
AlwaysUp.
-
Open a web browser and log in to the Kibana web application:
-
Enter the URL http://localhost:5601.
-
When prompted, enter the
elastic user credentials
(username=elastic, and the password that was generated
during installation).
-
Create a data view for MI log data.
-
On the application menu, under Analytics, click
Discover.
-
Click Create data view.
-
Enter a name for the new data view.
-
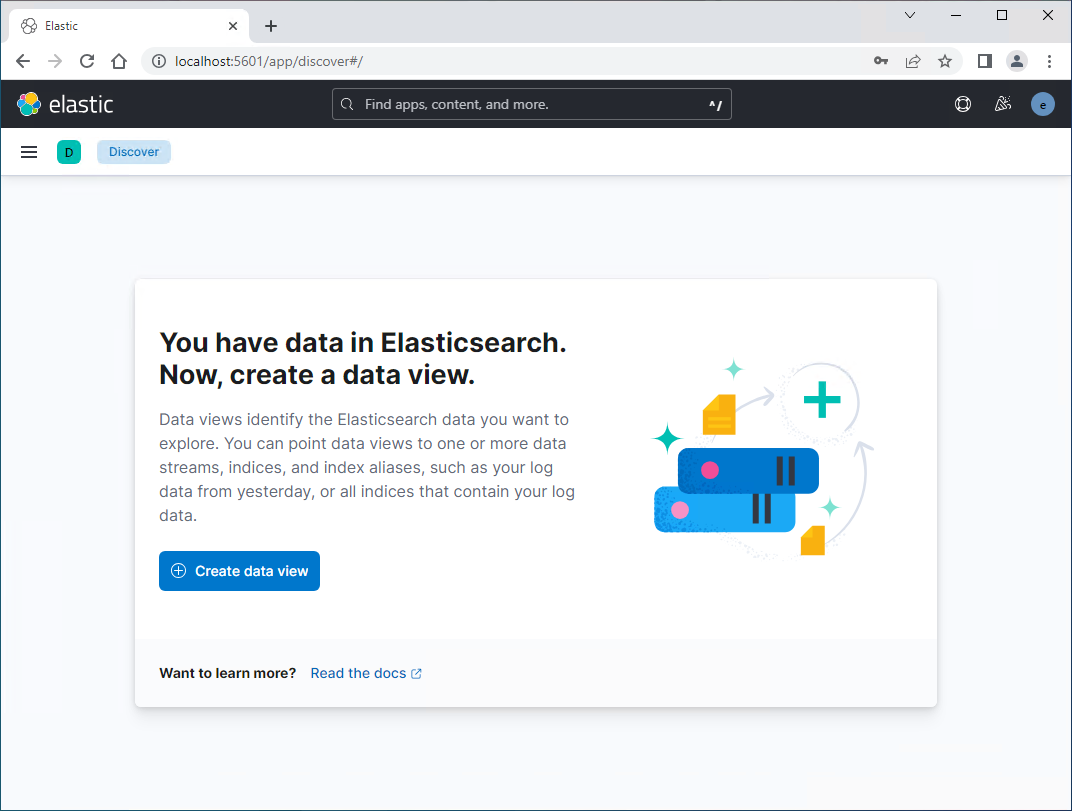
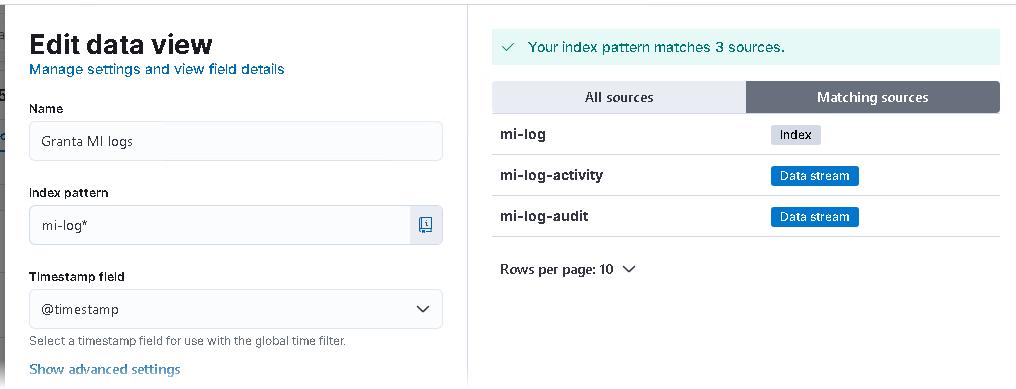
In the Index pattern field, enter mi-log* and
then click Save data view to Kibana.
-
Set a suitable log timespan, for example:
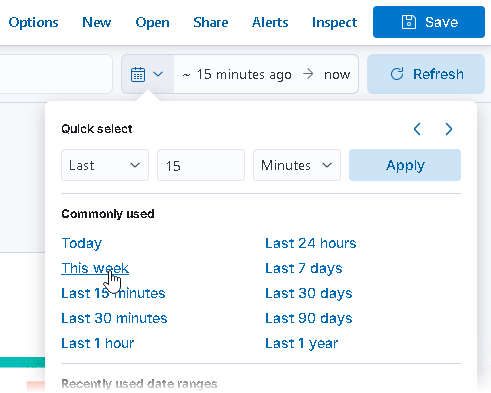
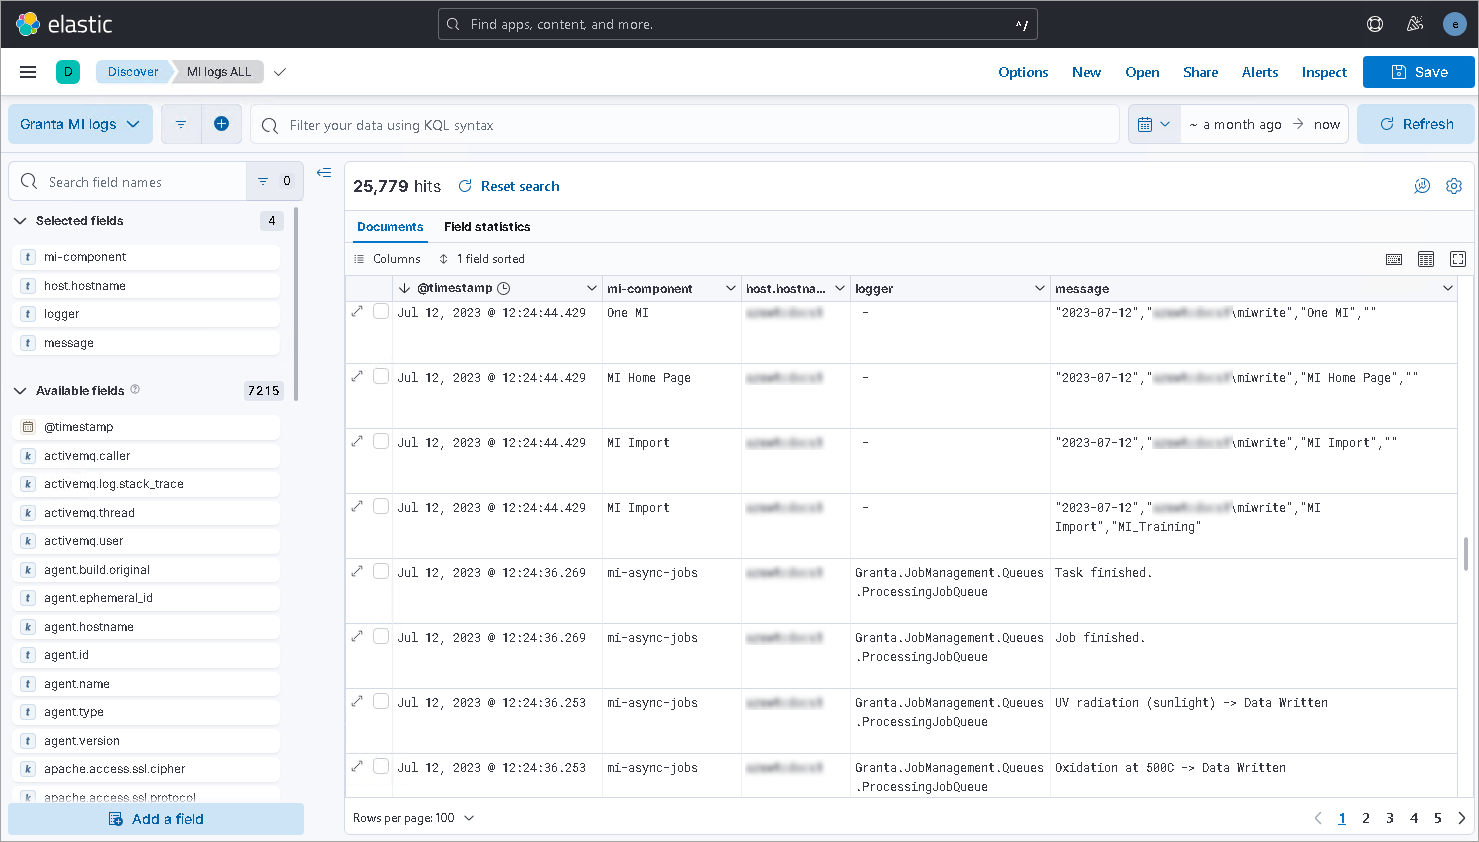
You will now be able to see all the available raw log data for the
specified time period.
-
Now add some useful columns, for example, mi-component,
host.name, logger, and message.
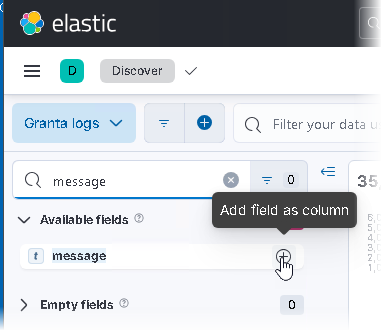
-
Click Refresh to update the search data at any
time.
-
Click Save to save your current search, which stores any
query text and filters, including the columns and sort order, and the data view.
Example:

For detailed information on the features available for
visualizing and querying data in Kibana, refer to the Kibana documentation.