


Customizing your visualization
You can use the following tools and options to customize the appearance and layout of your visualization.
Depending on your system configuration, you may be able to choose between different display options for your visualization. These control how the records are arranged (for example, in a hierarchical structure from left to right, or organically spaced out around your starting records), and how the links are represented (for example, individually, or clustered by link type).
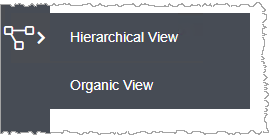
Your current display option is shown in the navigation bar at the top of the screen.

When you add or remove records, Link Visualizer automatically re-draws the visualization, arranging the records to optimize the visibility of all records and links. If you want to try out alternative optimizations, you can force Link Visualizer to re-draw the layout at any time.
-
To move individual records and links:
You might want to rearrange the records and links. For example, if Link Visualizer has drawn two links on top of each other, you can move one of the records so that both links are visible.
- You can move any record by selecting it then dragging and dropping it to a new location.
- If your current display option shows the link type as a node, then you can drag and drop the link type in the same way.
 to find and select all records of the
same type, or group them by adding the data table to
the visualization.
to find and select all records of the
same type, or group them by adding the data table to
the visualization. -
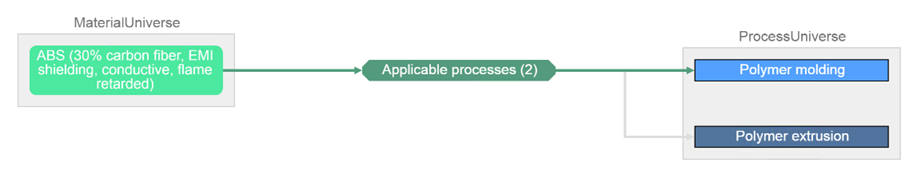
To add data tables to the visualization:
Optionally, you can include information about the data tables that the records belong to. This helps you recognize different types of record (for example, Material, Process) at a glance, and makes it easier to move them as a group.
Click at the top right of
the visualization pane to switch between the three options:
at the top right of
the visualization pane to switch between the three options:- Show data tables for all records in the visualization
- Show the data table that the currently-selected record belongs to
- Hide all data tables
- To change the shape of the box, drag and drop individual records, and the box will automatically resize to fit.
- To move the data table and its records as a group, click anywhere on the grey background, and then drag and drop it to a new location.