Summary
When you are viewing a dashboard, the Summary view shows an overview of the analysis for the assembly or product structure as a whole. If a baseline has been set, this view also shows a comparison between the baseline and the current design.
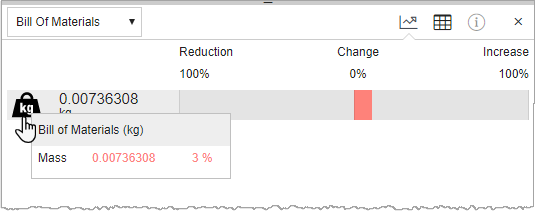
- Hover over an indicator for more information.
- Click an indicator to drill down into Details and see a full breakdown of the results by part.
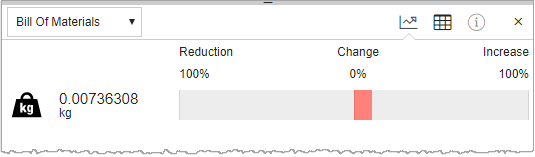
- The indicator value for the assembly is shown immediately to the right of the icon.
- The percentage bar (to the right of the indicator value) is empty if no baseline has been set. If a baseline has been set, the bar shows the percentage change in the indicator value between the baseline and the current design, calculated relative to the baseline.
When you hover over an indicator, additional information about how the indicator value for the assembly has been calculated will be displayed in a tooltip (if available). If a baseline has been set, the change between the baseline and the current design is displayed. For example: