


To generate an X-Y chart
Go to the Reports page to create X-Y charts.
- The Record List shows the currently-selected records. Add
or delete records from the list, as required, then click
 X-Y Chart.
The maximum number of records in a report is a user option and can be altered via Settings>Options
X-Y Chart.
The maximum number of records in a report is a user option and can be altered via Settings>Options
Click the View The Data command below the chart to view the underlying chart data in a table.
Click a bubble to bring the corresponding record to the top of the legend.
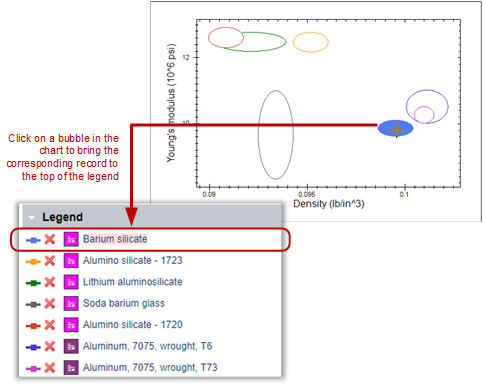
To see which bubble a particularly interesting record corresponds to, click the colored line in the legend: in the chart, the corresponding bubble is highlighted.