
Editing the Display Properties of Traces
To edit the display properties of a trace:
- Select a trace in an open Report window.
- Click the trace to view a docked
Properties window, or double-click to open the Properties dialog box. The display properties window for a trace includes
a General tab and an Attributes tab.
The General tab properties apply to the general appearance of the plot. They include the background color, contrast color, field width, and whether to use scientific notation for marker and delta marker displays. (X and Y notation display is set separately, in the Axis property tabs.)
The Attributes tab properties include the color, line style, line width, trace type, whether to show a symbol, symbol frequency, symbol style, whether to fill symbol, symbol color, and whether to show arrows.
Note:Box is the default symbol; it ensures that curves with single points always appear.
The Attributes tab applies specifically to the trace. The defaults are set in the Report2D options. They include:
- Name – Not editable by selecting the trace from the report. It shows the characteristics of the trace as defined in the Report dialog box. To edit a trace name, see Editing Trace Properties.
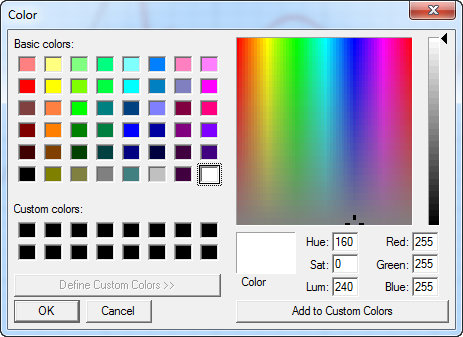
- Color
– Shows the trace color. Double-click to open a Color dialog box. You
can select from basic colors or custom colors. You can define up to 16
custom colors by selecting or by editing the hue, saturation, luminosity,
and the red, green, and blue values.
- Line style – Use this drop-down list to select Solid, Dot, Dash, or Dot-dash.
- Line width – Edit the numeric value in this text box.
- Trace type
– The drop-down list contains entries for Continuous, Discrete, Bar-zero,
Bar Infinity, Stick Zero, Stick Infinity, Histogram, Step, Stair, and
Digital.
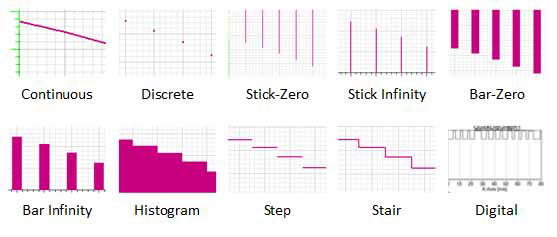
Notice the difference between Stair and Digital is that each stair centers on a data point with transitions halfway between points, and Digital transitions from each data point to the next value.
The next four properties work together to define whether to show a symbol on data points, the symbol frequency, the symbol style, and whether to display the symbol as solid or hollow.

- Show Symbol – Whether to show a symbol at the data points on the line.
- Symbol Frequency – How often to show symbols on the trace.
- Symbol Style – Use a drop-down list to select from Box, Circle, Vertical Ellipse, Horizontal Ellipse, Vertical Up Triangle, Vertical Down Triangle, Horizontal Left Triangle, Horizontal Right Triangle.
- Fill Symbol – Use this check box to set the symbol display as solid or hollow.
- Symbol Color – Shows the symbol color. Double-click to open a Color dialog box. You can select from basic or custom colors. You can define up to 16 custom colors by selecting or by editing the hue, saturation, luminosity, and the red, green, and blue values.
- Symbol Arrows – Use this check box to show or hide arrows on the curve.
- Edit the properties if needed, and click OK to apply the changes and close the window.