
Creating 3D Rectangular Plots
A 3D rectangular plot is an x-y-z graph of results.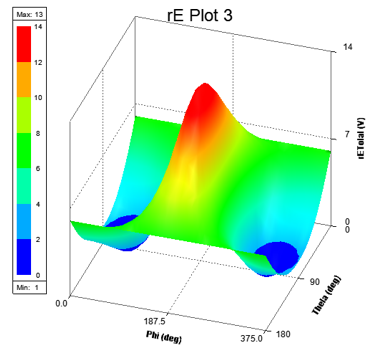
Working with a 3D Rectangular Plot
You can rotate, zoom, and pan a plot. When you rotate, the Cartesian grid responds so that the curve always remains in front and the grids behind.
Click a plot entity to select it and highlight it in bold.
Double-click anywhere in the plot to open the Properties dialog box. The properties are grouped appropriately under various tabs, which correspond to plot entities:
- General – For general plot properties such as visual detail level and background color.
- Header – Properties related to plot header/title.
- Axis [X|Y|Z] – Properties related to the 3 axes.
- Grid [XY|YZ|ZX] – Properties related to the 3 grids.
- ColorKey – Properties related to ColorKey, including borders, background, min and max, as well as number format and precision.
- Contour – Properties related to contouring of all curves/surfaces.
- Surface – Properties related to the curve.
Selecting a property also displays its properties in the Property window. You can edit the properties to customize the appearance of the plot. See Controlling Visual Detail in a 3D Rectangular Plot.
Creating a 3D Rectangular Plot
- Select Twin Builder > Results > Create > Standard Report > 3D Rectangular Plot. The Report dialog box appears.
- In the Context section, make selections
from the following field or fields, depending on the design and solution
type.
- Solution – Lists the available solutions, whether sweeps or adaptive passes.
- Domain – Whether this field appears, and
the domains listed depend on the Solution type and the <type>
selected. The domain can be Sweep, Spectral, or Time.
When Spectral is selected, additional fields display in which you can make settings for plotting spectral domain data. The magnitude function mag() is also applied to quantities selected for plotting in the Z field.
- Optimetrics setup – Lists all defined Optimetrics analysis setups.
- Select Quantities – Click to open the Select Quantities dialog box in which you can select additional quantities for plotting.
- Under the Z
Component area, specify the information to plot along the Z-axis:
- Category – Select the type of information to plot.
- Quantity – Select the value to plot.
- Function list – Select the mathematical function of the quantity to plot.
- The Z field displays the currently
specified quantity and function. You can edit this field.
Note:
- The text color shows whether the expression is valid (blue for valid expressions, red for invalid).
- When Spectral is selected, the magnitude function mag() is applied to quantities selected for plotting in the Z field.
- Range Function – Click to open the Set Range Function dialog box. This applies currently specified quantity and function.
- On the Y
(secondary sweep) lines, specify the information to plot along the Y-axis
in one of the following ways:
- Select the sweep variable to use from the drop-down list.
- If sweeps are available, click
 to select particular values.
The quantity is plotted against the primary sweep variable listed.
to select particular values.
The quantity is plotted against the primary sweep variable listed.
- On the X
(primary sweep) lines, specify the information to plot along the X-axis
in one of the following ways:
- Select the sweep variable to use from the drop-down list.
- If sweeps are available, click to select particular values.
The quantity is plotted against the primary sweep variable listed.
- Click New Report.
This creates a new report in Project tree, displays the report with the defined trace, and enables Add Trace on the Report dialog box. The default name is based on the report category you selected, (for example, S Parameter Plot n or rE Plot n). You can edit the plot names in the Project tree and the plot header text in the report synchronizes.
The function of the selected quantity or quantities is plotted against the values you specified on an x-y-z graph. The plot is listed under Results in the Project tree. When you select the traces or plots, axis or grid labels, plot header, color key, or variable labels, their properties appear in the Properties dialog box. You can edit the properties for each plot element to modify the plot content and appearance. See Modifying the Background Properties of a Report.
- Optionally, add another trace to the plot by following the procedure above, using Add Trace rather than New Report.