
Computing a Crosstalk Scan - Time Domain
You can perform a time domain crosstalk scan on either a single-ended net or on a differential pair.
Signal and impedance settings for differential pairs refer only to the differential signal.
Likewise, differential pair results refer only to the differential signal.
To run the time domain crosstalk scan in SIwave:
- Click Simulation.
- From the SIwave area, select Crosstalk Scan > Time Domain.
- Find the nets you want to analyze:
- For single-ended nets, select the Single-Ended or Extended tab.
- For differential pairs, select the Differential or Extended Differential tab.
Note:
An extended differential net must have both a corresponding extended net definition pair and a corresponding differential net definition set containing at least 2 entries.
- Select nets and use the Add and Remove buttons to determine which will be analyzed.
If you want to include all nets selected in the layout, click Include Nets Selected in Layout.
- Click Next.
- User the Single Ended, Differential, Extended, and Extended Differential tabs to find nets.
- Select a net by clicking to the left of its row, then select your appropriate options.
- Click Launch to run the simulation.
The Time Domain Crosstalk Scan window appears, on the Single-Ended nets tab.

The FEXT/NEXT Time Domain Crosstalk Scan window appears.

To view peak voltages:
- Click Results.
- From the SIwave area, select Time Domain Crosstalk Scan > [Simulation Name].
- Click View Peak Voltages.
- Show background toggles the shadowing behind the bars.
- Show grid toggles the grid lines.
- Axes titles visible toggles the display of the axis titles.
- Show color scale toggles the display of a color scale used for the voltage.
- To select a pair of nets, click on the bar. Select nets in main frame causes any selected net pairs to be selected in the SIwave Modeling workspace. The names of the selected nets are displayed in the Current selected nets field, and the voltage is displayed in the Voltage field; these fields are just below the Select nets in the main frame check box.
- Change bar style toggles between Cylinder (circular) and Bar (rectangular) shapes.
- Change plot view selects one of four views: Isometric view (3D effect with perspective), X-axis view, Y-axis view, or Top view.
- Change color scheme selects the color pattern used for the bars: Smooth gradient, Heat map (lower voltages cooler, higher voltages hotter), and Primary color (all bars the same color).
- Change selection mode provides a menu in two parts. The first six options determine how much gets selected when you click on a bar: Bar, Row, Bar and Row, Column, or Bar and Column. Then the last four options allow you to change the display from 3D to 2D slice of the selected bar, row, or column: Slice into Row; Slice into Column; Slice into Row, Item; or Slice into Colum, Item. You must have something selected to get the 2D slice.
- The Adjust label orientation slider controls the positions of the net names.
- The Adjust label font size slider controls the size of the font used for the net names.
- The Rotate horizontally and Rotate vertically sliders control the orientation of the 3D plot.
Note:
You can also rotate the plot by holding down the middle mouse button and dragging, or by pressing Alt plus the left mouse button and dragging.
- You can zoom the display by rotating the mouse wheel or by pressing Shift Alt plus the left mouse button and dragging.
- You can reset the view by pressing Shift Alt plus double-clicking the left mouse button.
- By default, the Curve type shows the near end voltage [V(next)] and the far end voltage [V(fext)]. Use the check boxes in the Curve type panel to display the input voltage [V(in)] or the output voltage [V(out)].
- the check box Show curves for multiple bars allows you to accumulate traces from multiple bars as you select each one in turn.
- The Axis settings panel controls the range and units to be used for the X- and Y-axes in the waveform plot.
- Click Clear plot to clear the waveform plot.
The Crosstalk Peak Voltage Viewer window appears.
If appropriate, click Show Voltage to display the plot.
At any time, use the check box to Maintain original net selections on close.
The 3D Peak Voltage Plot appears with the 3D bar chart representing peak voltages in the upper section of the display. One axis of the 3D plot represents aggressor nets and the other represents victim nets.
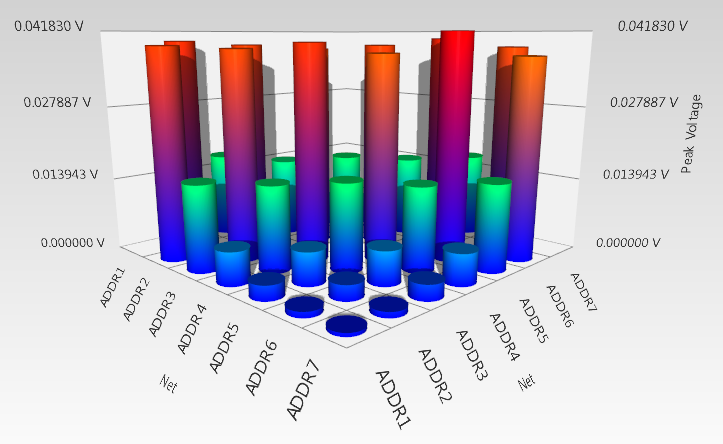
Use the Plot type menu to select Near End Peak Voltage or Far End Peak Voltage to be displayed.
Use the check boxes and menus in the Bar graph settings panel to control the plot appearance:
The lower portion of the Peak Voltage display is a 2D time domain Waveform of the voltages. Click on a bar to display the corresponding waveform:
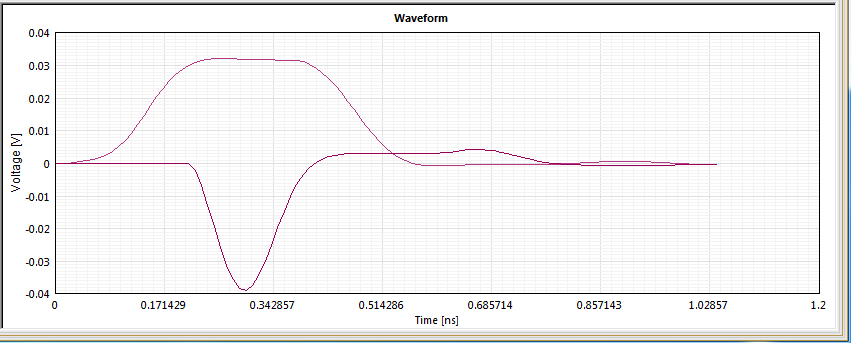
The titles of the traces display when you move the cursor over the traces.
To view time domain crosstalk maximum voltages, click Results > SIwave > Time Domain Crosstalk Scan. Then select the simulation name and click Display Time Domain crosstalk max voltages.
To see what portions of the geometry are being coupled, click Results > SIwave > Time Domain Crosstalk Scan. Then select the simulation name and click Display Coupled Structures. Thick and thin colored lines are visible along with thick gray lines. The gray color signifies that a portion is not coupled to anything, while other colors signify coupling to other traces or planes. Thick lines represent traces, and thin lines show plane edges. A colored (thick or thin) line signifies that it is coupled to another trace or plane edge. Gray lines (trace only) are not coupled. Uncoupled plane edges are not visible, so there are no thin gray lines. When this option is selected, you can toggle it off by selecting Hide Coupled Structures.
To display a summary of CPU and memory usage during the crosstalk scan, select the simulation name and click View Profile.
To view nets and pins that were selected for the simulation, click Results > SIwave > Time Domain Crosstalk Scan. Then select the simulation name and click View Simulation Properties.
To rename the simulation, click Results > SIwave > Time Domain Crosstalk Scan. Then select the simulation name and click Rename Solution.
To delete the simulation, click Results > SIwave > Time Domain Crosstalk Scan. Then select the simulation name and click Delete Solution.
You can also automate crosstalk scanning.